The Good, the Bad, and the Sideways

Key Takeaways
- While major indexes reach new all-time highs, underlying market breadth remains weak.
- MSI and AXP highlight critical tests of the 200-day moving average.
- Tesla (TSLA) continues to move sideways, forming a symmetrical triangle pattern.
While the US equity averages continue to push to new all-time highs, weakening breadth indicators provide a stark reminder that not every stock is following the trend of the major benchmarks. In this article, we'll look at three charts that are in very different trend phases, with a brief discussion of which levels and signals we’re watching in August.
By the way, these are three of the stocks I featured in this week’s Top Ten Charts to Watch for August 2025, including a deeper discussion of technical implications and broader takeaways!
Motorola Solutions (MSI): Testing the 200-Day From Below
While many investors have been focused on the dominance of mega-cap growth stocks, other areas of the market have shown some real strength in recent weeks. Motorola Solutions, Inc. (MSI) stands out as a stock testing a key moving average from below.
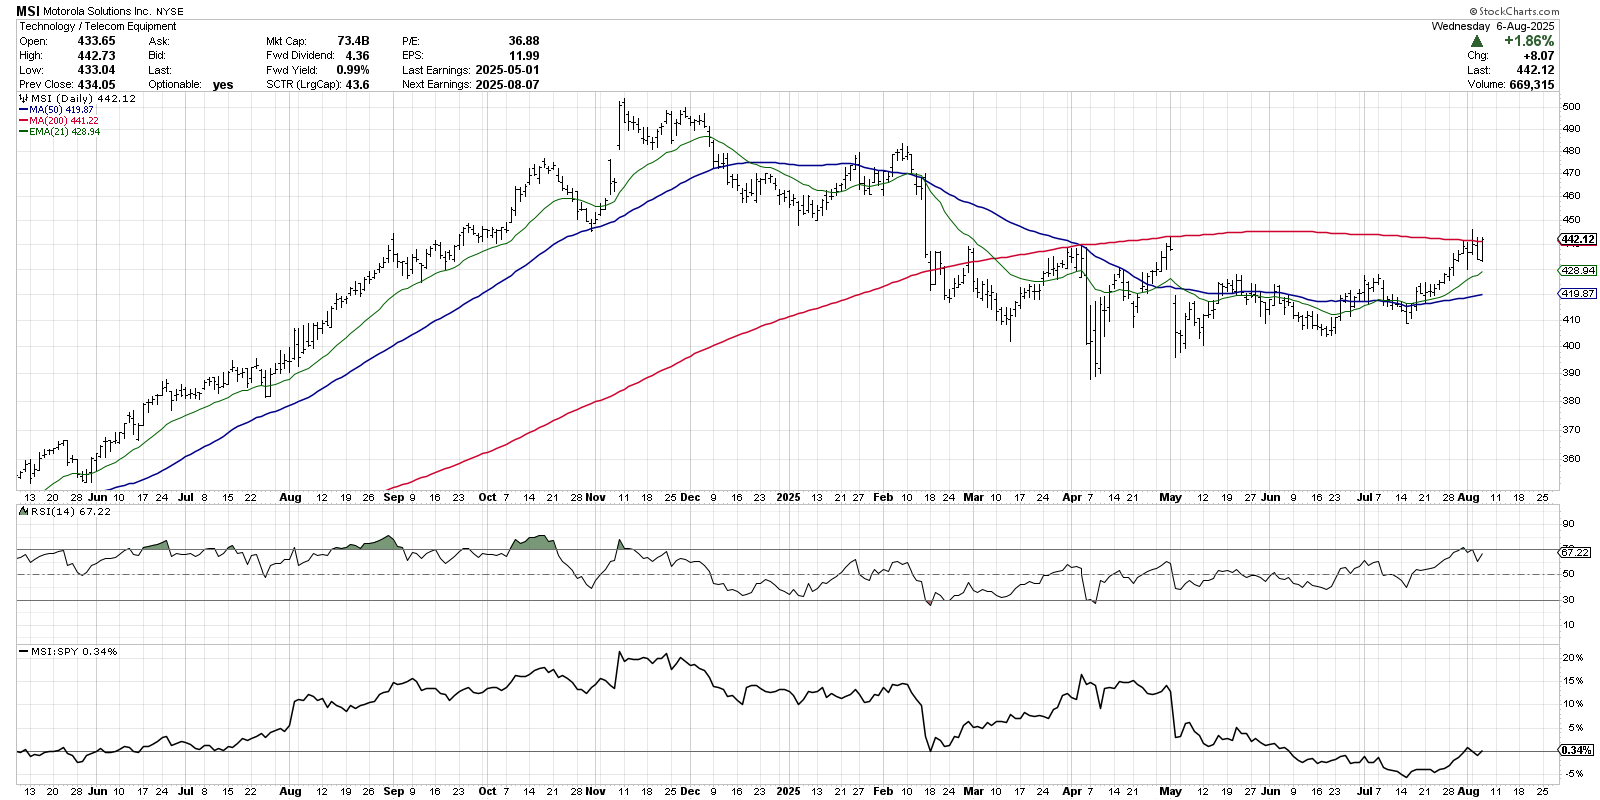
MSI popped up on my radar in late July, when it broke above the $430 level to achieve a new three-month high. The stock has since drifted higher, now facing the “ultimate” resistance level in the form of the 200-day moving average. Similar rallies in April ended up stalling out at this long-term trend barometer, which means it would take a significant influx of buying power to push the stock above this threshold.
I think of this sort of chart as an “if-then” statement to define your potential entry point. In this case, if MSI can push above resistance around $440, and confirm that breakout with improved momentum and volume characteristics, then I would expect a move higher to retest the February high around $480.
Pro Tip: This is a perfect example of when the StockCharts Alerts system can be a key part of your investing workflow. Simply set a price alert for when MSI breaks above $440, and then just wait for the alert to light up!
American Express (AXP): Testing the 200-Day From Above
While Motorola is testing the 200-day moving average from below, this next chart has recently found support at the 200-day. American Express Co. (AXP) formed a classic “double top” pattern, with major peaks around $325 in January and July. After pulling back from the July peak, AXP is now testing this crucial long-term moving average.
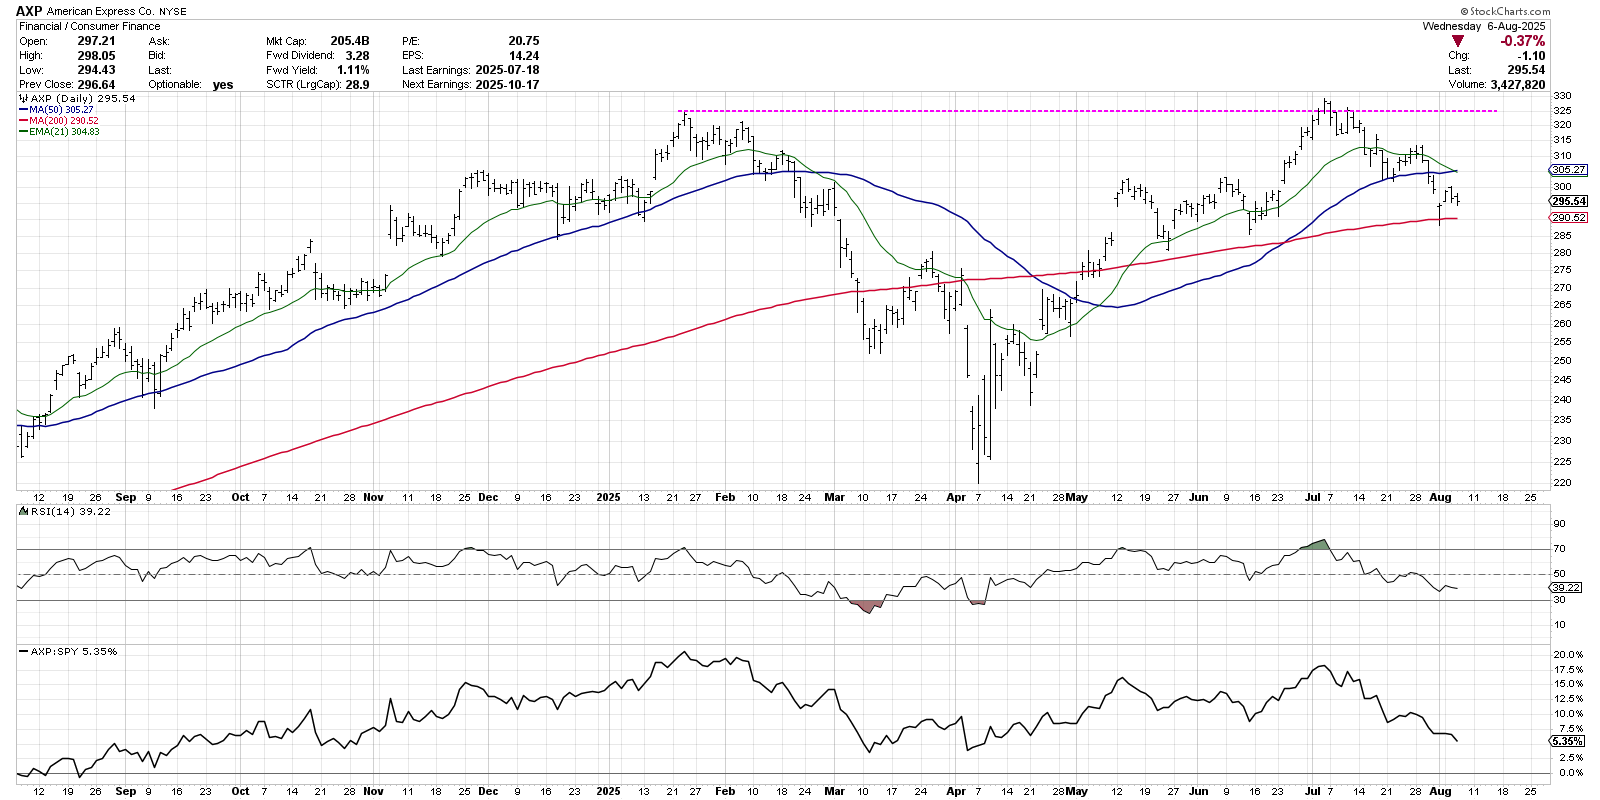
Note the hammer candle on the day AXP tested the 200-day moving average, serving as a friendly reminder that context matters when evaluating short-term signals like candle patterns. For now, AXP is holding the 200-day, but a confirmed break below this key moving average would suggest much further downside for this leading financial name.
Tesla (TSLA): Yep, Still Rangebound
Our final example, Tesla, Inc. (TSLA), is not in an uptrend or downtrend phase. This chart is demonstrating a sideways trend, or a “narrowing of the range” with lower highs and higher lows. The classic technical analysis texts would consider this a symmetrical triangle or “coil” pattern, indicating an equilibrium between buyers and sellers.
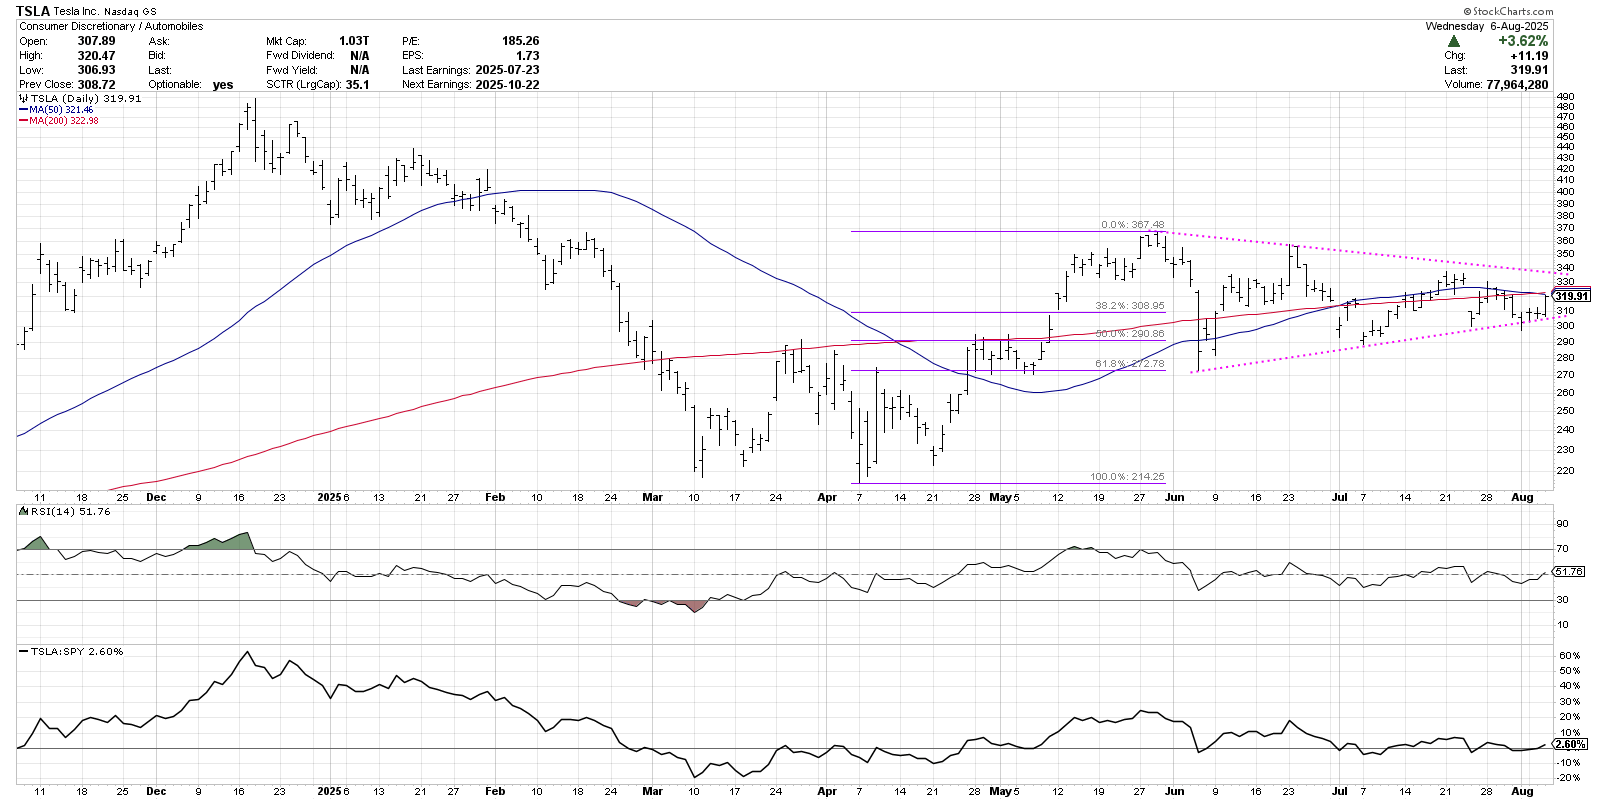
This pattern is one of the easiest to play, because the best strategy is often a “sit on your hands” approach. Until there is a valid breakout from the pattern, either to the upside or the downside, this chart remains decidedly neutral. This means that a break above the upper trendline, or a breakdown below the lower trendline, would be the trigger that would indicate a resolution to the pattern.
Technical analysis is often less about getting the analysis right and more about finding the right charts to look at in the first place! Here are three charts that I would argue are near actionable price levels, which also provide a clear opportunity to use technical analysis tools to identify potential entry points and manage risk.
For the other seven charts, along with a deeper discussion of issues of risk versus reward, check out my latest video on the StockCharts TV YouTube channel!
RR#6,
Dave
P.S. Ready to upgrade your investment process? Check out my free behavioral investing course!
David Keller, CMT
President and Chief Strategist
Sierra Alpha Research LLC
marketmisbehavior.com
https://www.youtube.com/c/MarketMisbehavior
Disclaimer: This blog is for educational purposes only and should not be construed as financial advice. The ideas and strategies should never be used without first assessing your own personal and financial situation, or without consulting a financial professional.
The author does not have a position in mentioned securities at the time of publication. Any opinions expressed herein are solely those of the author and do not in any way represent the views or opinions of any other person or entity.


