Is It Time to Take Another Look at China?

While the US and many overseas markets have been on a tear, Chinese equities, in the form of the Shanghai Composite ($SSEC), have just experienced a mega breakout to the upside, suggesting that the fun has only just begun.
Chart 1 illustrates my point, as the $SSEC has just convincingly broken above its secular bear market down trendline, going back to late 2007. This action is also being supported by the long-term KST, which has crossed above zero for the sixth time this century. Two of them, featured as dashed arrows, were false positives. Even in these instances, however, the red dashed arrows above the price indicate that using negative 24-month moving average crossovers as a sell signal would have limited losses.
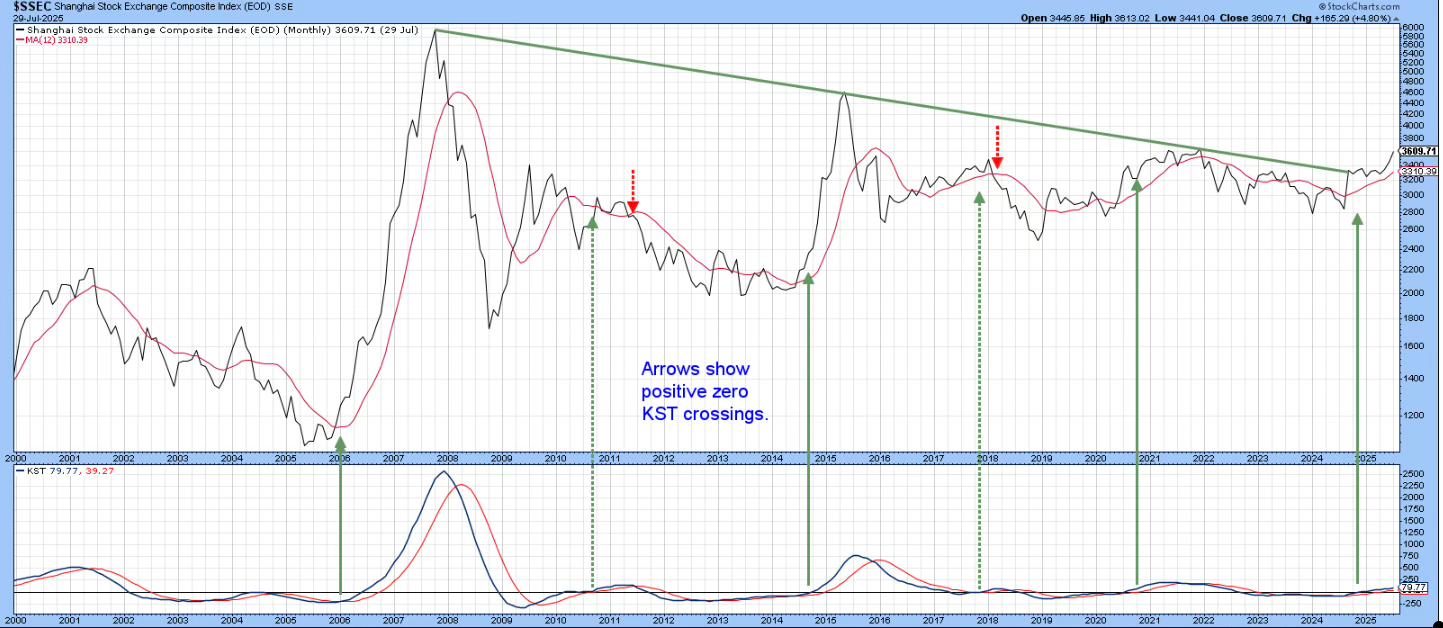
Chart 2 features the Percentage Price Oscillator (PPO) model, which, for monthly charts, incorporates the 6 and 15 parameters. The shaded areas indicate when the PPO itself is trading above its equilibrium level in a decisive and extended manner. Such periods contain most of the important rallies and avoid the majority of declines. The PPO is currently in a bullish mode and has also started to re-accelerate to the upside.
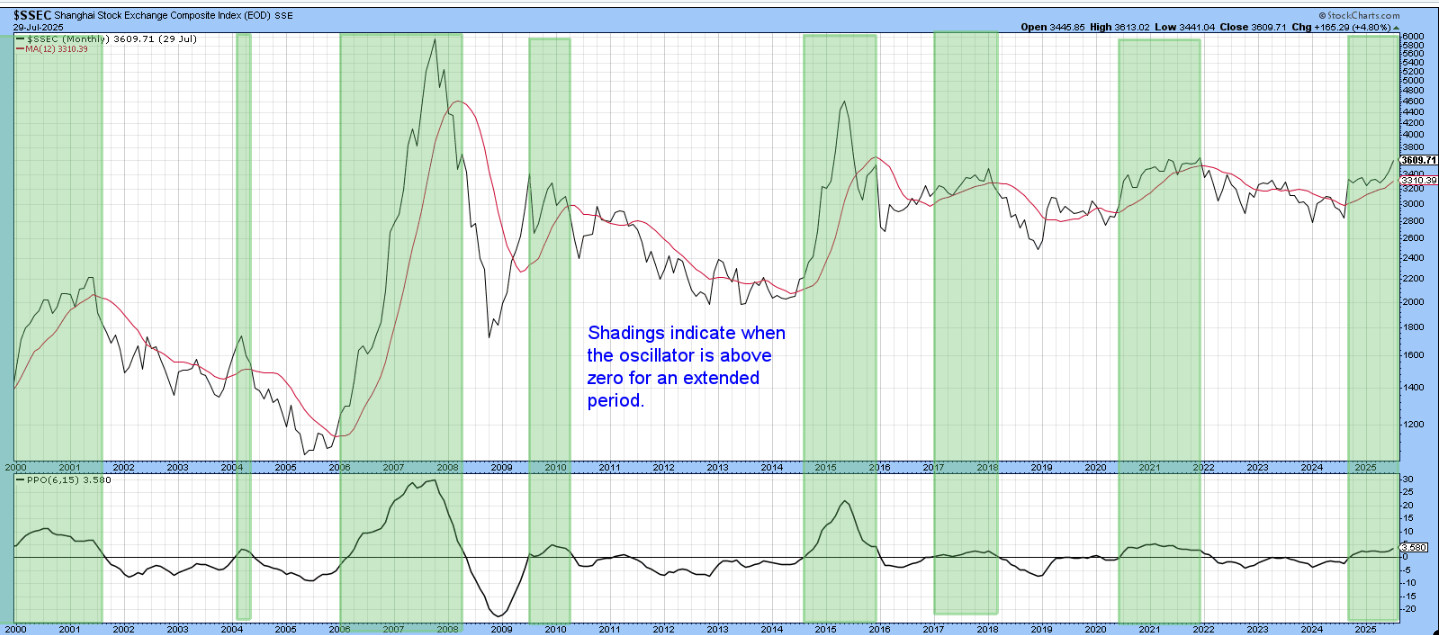
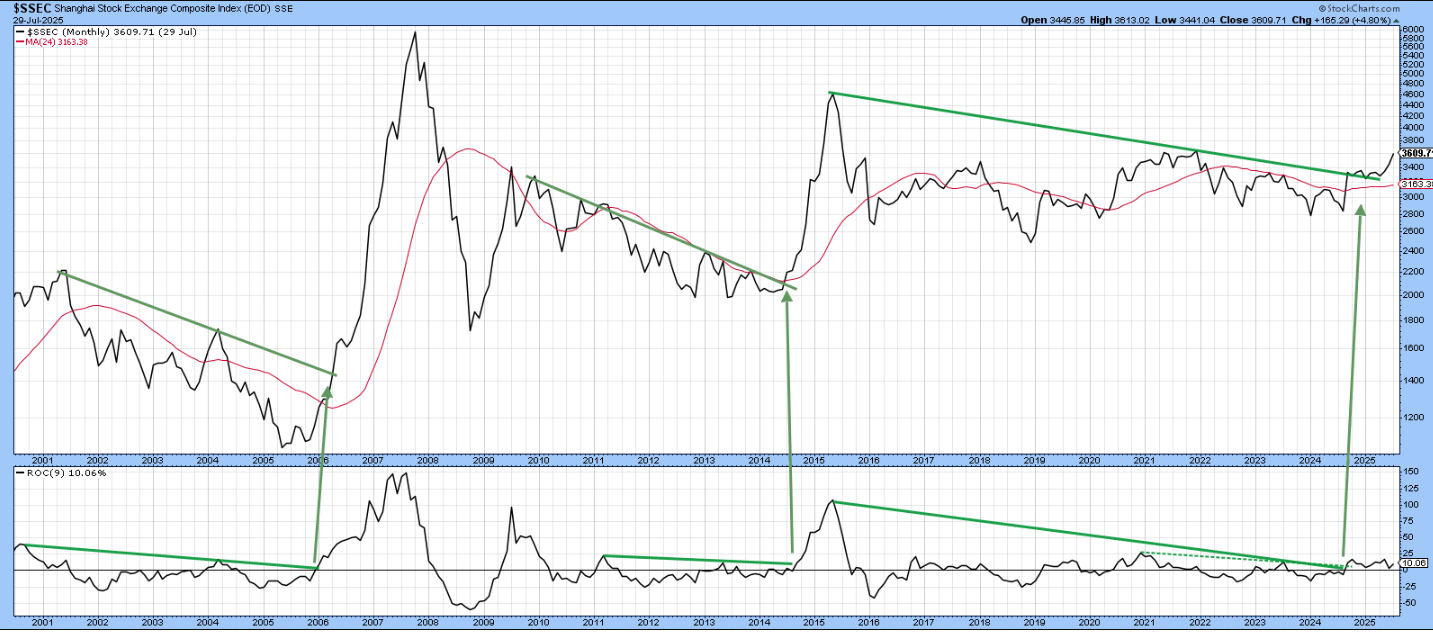
Chart 3 shows that there have been two explosive rallies since 2000. These took place between 2006 and 2008 and 2014-2015. In each instance, it was possible to construct two trendlines, one for the index and a corresponding line for the Rate of Change (ROC); strong rallies followed their joint upside penetration. Fast forward to the current situation, and a third example has just emerged. I am not saying the expected rally will replicate its two predecessors in terms of magnitude or speed, but an explosive move should not be ruled out either.
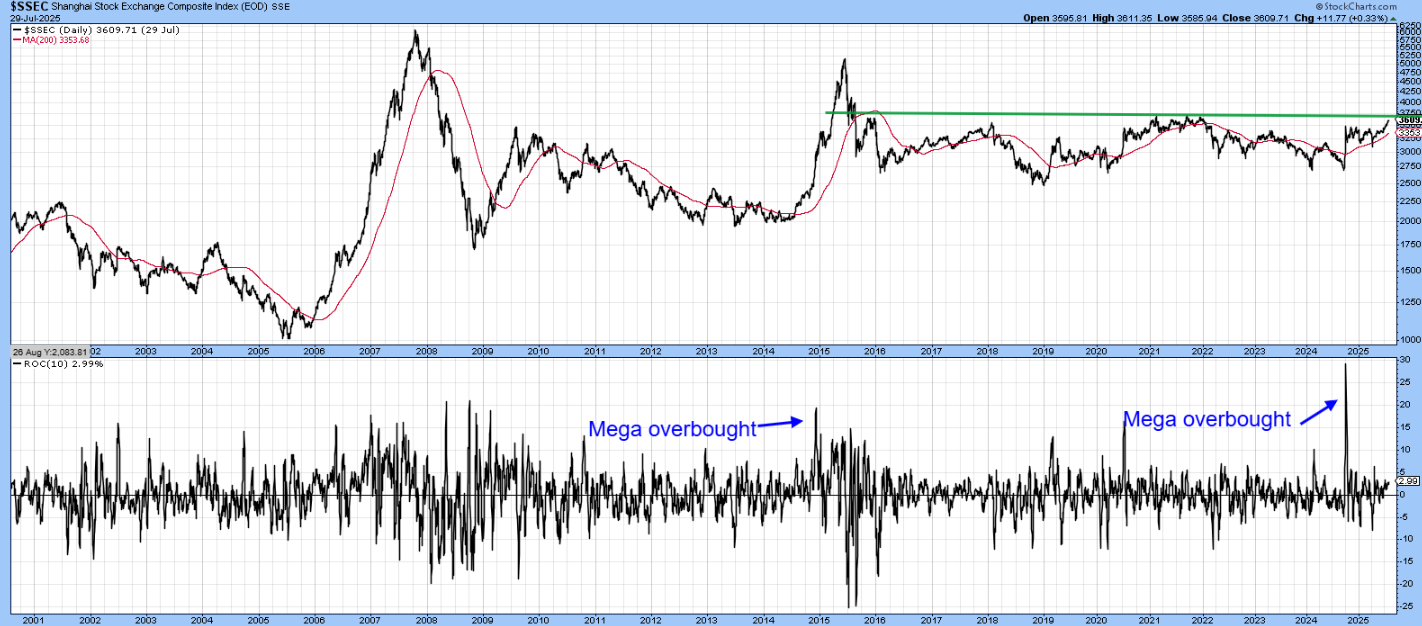
Finally, Chart 4 compares the $SSEC to its 10-day ROC. It is evident that the 2014-15 rally began with a mega-overbought reading in the ROC. Mega-overboughts are relatively rare short-term momentum conditions that function as early indications that the previous primary downtrend has reversed to the upside. They exceed any readings experienced in the previous primary bear and usually the preceding bull market. That was not the case in 2014, though it was a 5-year high. However, the overbought condition witnessed in 2024 was a record reading exceeding anything seen since the mid-1990s. Make no mistake, this was a very powerful signal, suggesting that 2024 experienced a major reversal.
Chinese ETFs
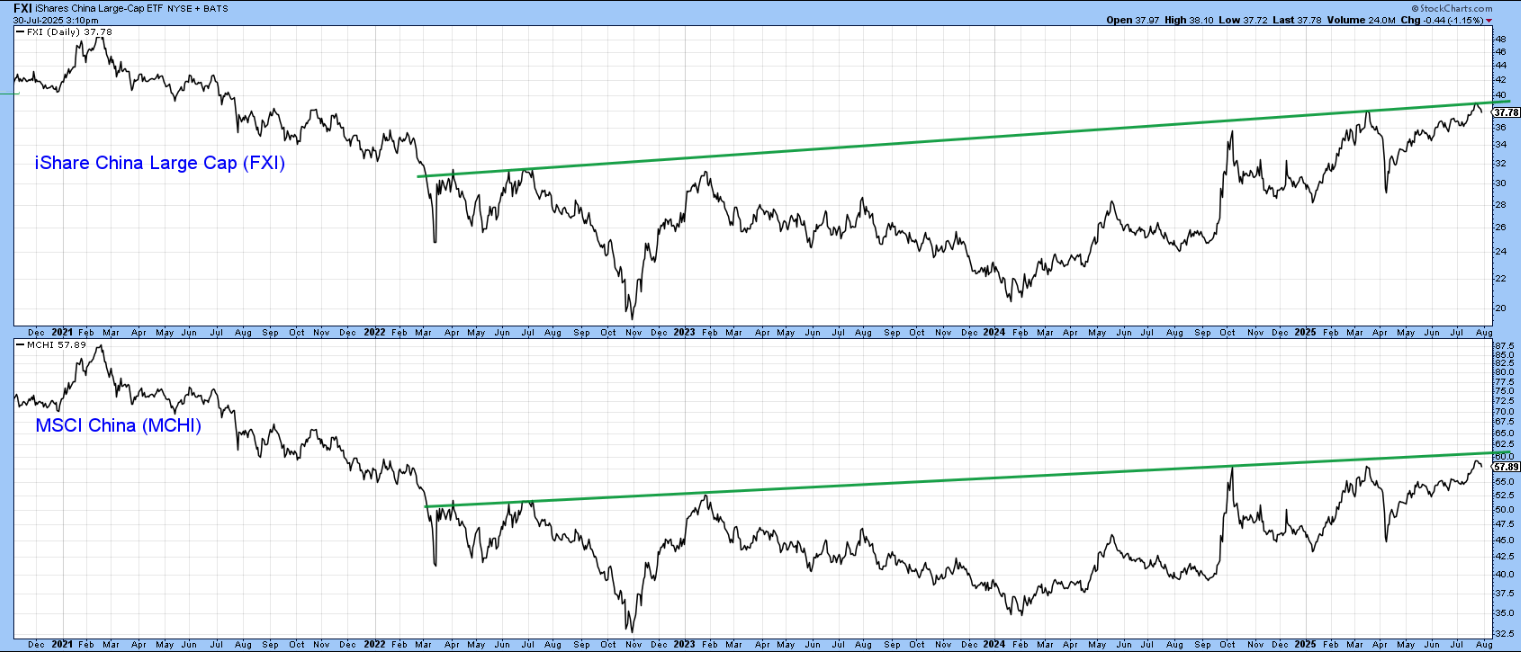
Two of the most liquid Chinese ETFs are the iShares China Large Cap (FXI) which offers exposure to 50 of the larger Chinese companies listed on the Hong Kong Stock Exchange. Alternatively, the iShares MSCI China ETF (MCHI) offers exposure to large and mid-cap Chinese equities listed in China, the US, and Hong Kong.
Chart 5 shows that both are currently running into important resistance. The first four charts in this article make the case for an upside breakout, but, in view of the recent run-up, it would not be surprising to see a short-term correction develop first.
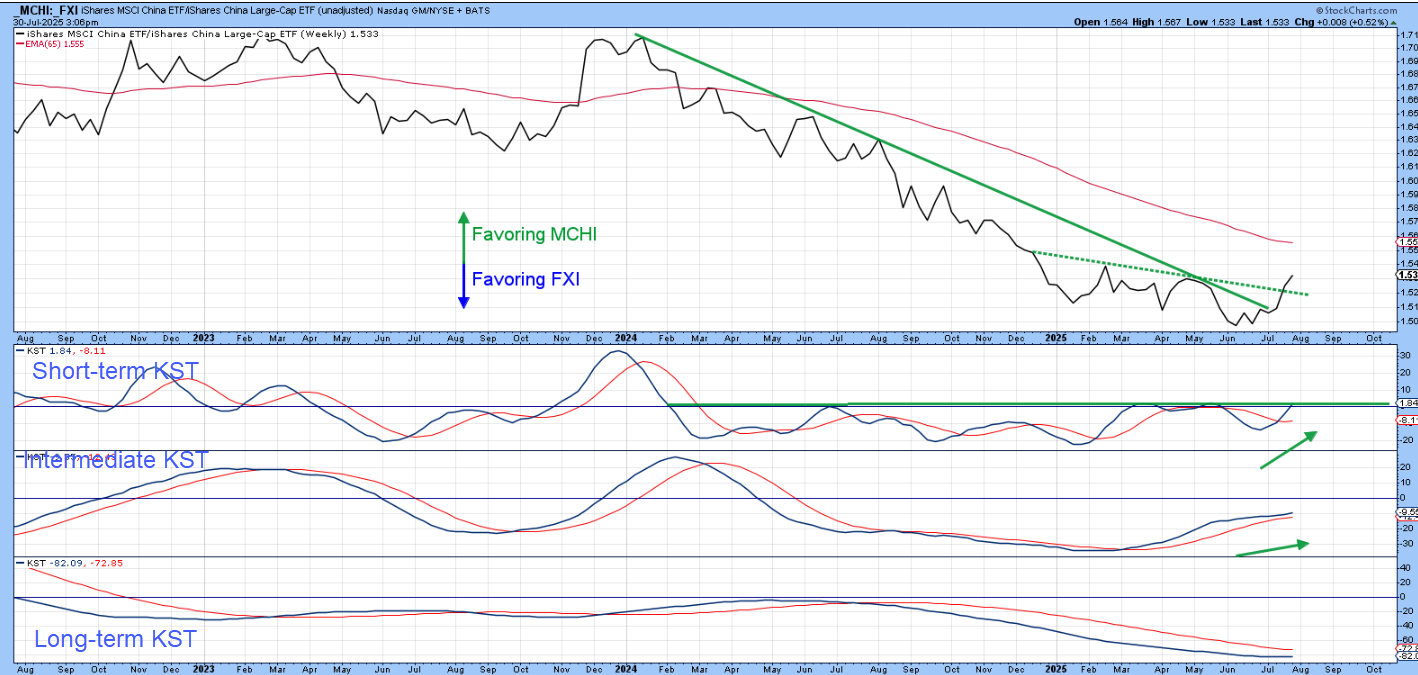
Finally, Chart 6 compares the recent performance of the FXI versus the MCHI. The FXI has been winning hands-down, but the ratio has violated the down trendline and broken out from a small base. The short- and intermediate-term KSTs are in a bullish mode, which suggests the ratio is headed higher, i.e., favoring the MCHI.
Good luck and good charting,
Martin J. Pring
The views expressed in this article are those of the author and do not necessarily reflect the position or opinion of Pring Turner Capital Group of Walnut Creek or its affiliates.


