Is It Time For a Comeback? 3 Stocks That Might Be Turning a Corner
Key Takeaways
- UPS stock remains stuck in a longer-term downtrend. A short-term bounce is possible, but more confirmation is needed.
- UNH stock price is under heavy pressure, and technicals show no bottoming yet, making it a high-risk setup for now.
- MRK stock stands out as the strongest technical setup, breaking out of a downtrend with improving momentum across multiple time frames.
This week, we’re checking in on some stocks that have fallen on tough times and are hoping this is the quarter they start turning things around.
We received great feedback when we featured these kinds of turnaround stories before, so we’re back with more. Let’s keep things simple and focused, especially on where the risk/reward setup looks the most promising.
A Quick Technical Turnaround Checklist
Here’s what to look for when spotting a possible comeback:
🟢 Has the stock stopped falling?
🟢 Is the longer-term downtrend broken?
🟢 Are we trading above key moving averages?
🟢 Are momentum indicators like the RSI and MACD flashing buy signals?
🟢 When in doubt, zoom out. How does it look across multiple time frames?
UPS Stock: A Long Road Back?
UPS stock has had a bumpy ride lately. Its stock price has fallen after 10 of the last 13 quarterly reports, with an average one-day loss of -3.6%. Even amid EPS beats, shares have declined due to disappointing guidance.
Growth concerns continue. Since 2022, revenue and net income have declined, and EPS is still below 2020 levels. Throw in profit deterioration due to tariffs, weaker small-business demand, and Amazon share loss, and it’s no surprise that investors have been taking their portfolio allocations to more promising destinations.
So what now? Is this a lost cause, or could UPS be setting up for a bounce? We need to analyze UPS on multiple time frames to truly demonstrate how frustrating it has been for its shareholders.
The one-year daily chart of UPS (see below) is showing signs of life and could see shares rally back to its 200-day moving average at $112.
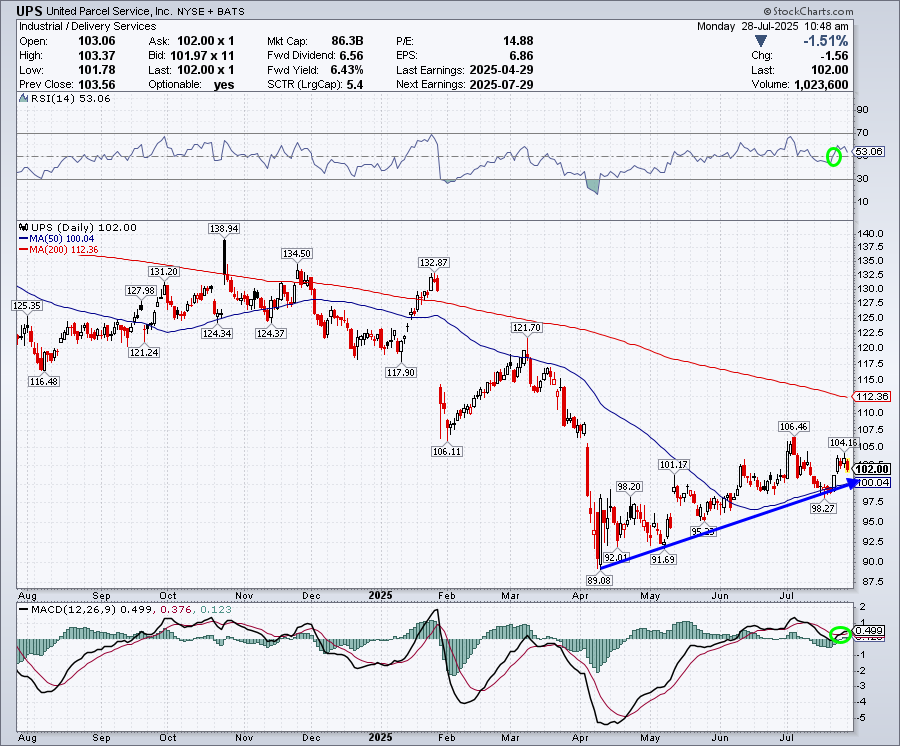
However, looking at the checklist over multiple time frames, you still need to see more evidence that the worst is over.
🟢 Shares have stopped sliding.
🔴 Shares have not broken their longer-term downtrend.
🟡 Shares are above the 50-day moving average, but 10% below the 200-day.
🟢 Momentum indicators are positive.
Let’s look at the longer-term chart — a three-year weekly (below) — and see if there is progress.
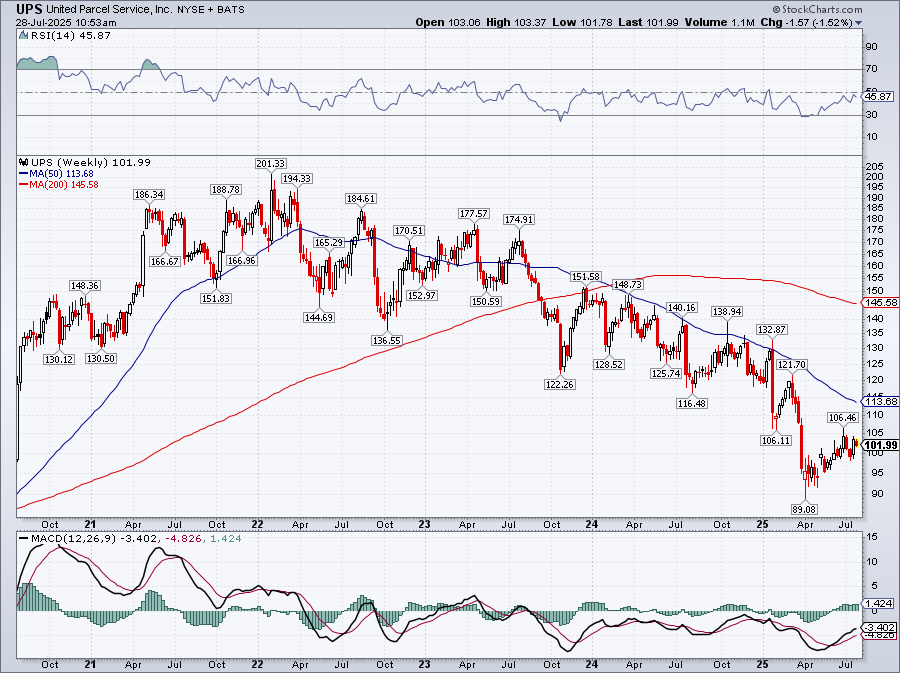
You can see from the chart that shares remain in their long-term downtrend. In order to keep it simple, we didn’t draw any lines on the chart. The 50-week moving average is the clear line of demarcation here, and UPS consistently trends below it.
The good news is that UPS could rally to that average at $114 and give a short-term investor a nice profit. However, the downside risk is a dip back to recent lows. That is not the ideal set-up, but possibly favorable over the near term.
Over the long term, shares still have some work to do. Usually, for turnarounds to occur, it takes multiple quarters of good news and positive price action. We have one good one in the books. Let’s see if UPS can make it two this week when it reports.
UnitedHealth Group, Inc. (UNH): A Messy Situation
UNH has had a rough year. A high-profile executive was murdered, the CEO resigned after an earnings shortfall, and now the company is facing a DOJ investigation into its Medicare billing practices. While the company is complying with the formal civil and criminal requests, it is yet another black eye for the beleaguered and once mighty Dow stock.
This week, UNH reports earnings under a sea of scrutiny and hopes that quarterly results may be the one positive caveat of news to help stabilize its sinking stock price. Shares are lower by -44% year-to-date and have declined by an average of -12% after their last three reports.
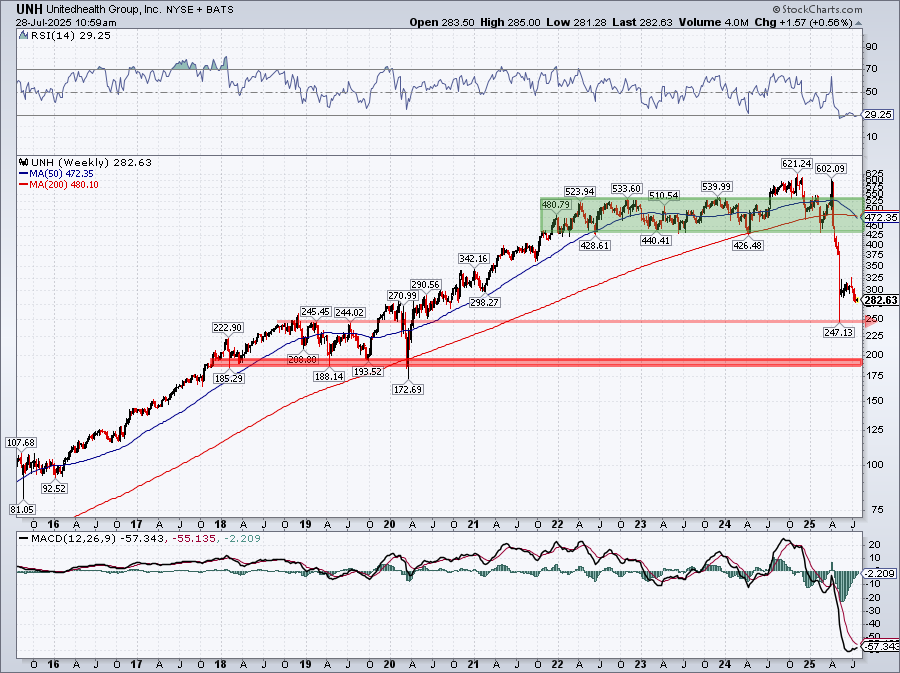
Technically, we need to step back and look at this over the long term to put this sell-off into perspective. It’s always tempting to want to try and catch a falling knife, but that can be a dangerous way to trade.
The near-term chart of UNH is a disaster, but the larger timeframe presents a more manageable scenario. Right now, the stock doesn’t meet the turnaround criteria, but has levels where it may settle and give someone a tradable bounce. A re-test of the near-term lows just under $250 could be a good place to enter a trade for that bounce.
All momentum indicators are oversold, but that doesn't mean the worst is over. Given the constant flow of negative news, a potential washout to below $200 could occur. That was a heavy consolidation area for two years and should hopefully hold if the stock were to go through another negative news cycle.
Overall, we are trying to see if there are logical levels to dip the toe into the water where your risk/reward setup is somewhat favorable. In this case, there is still too much risk, and signs of a bottoming process have yet to begin.
MRK Stock: The Bright Spot
Merck (MRK) looks like the most promising of the bunch this week. The stock started to rally ahead of this Tuesday’s earnings.
Looking at the one-year daily chart below, we see nothing but positives when checking our reversal checklist.
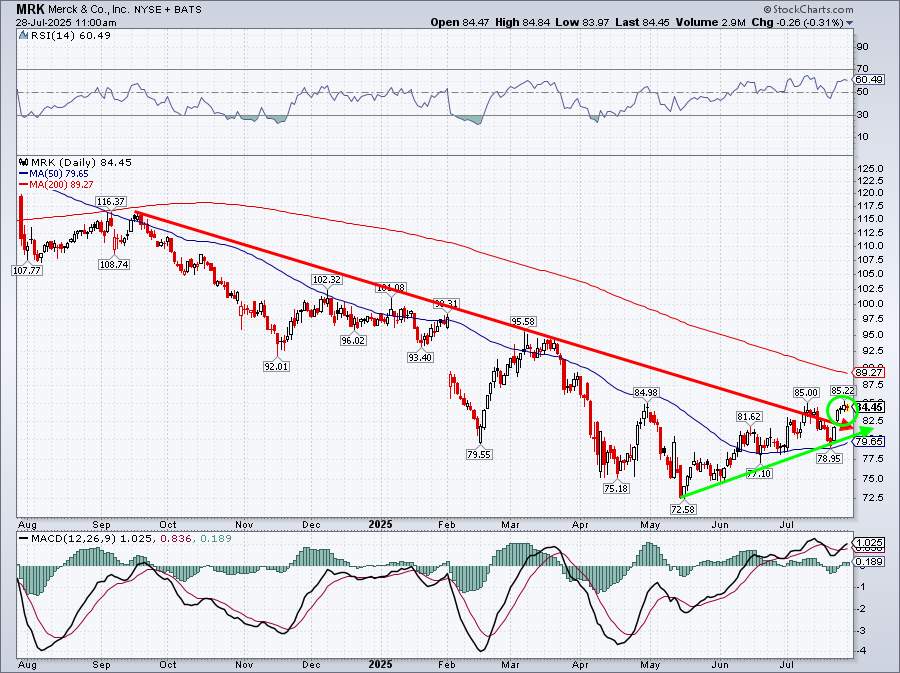
🟢 MRK stock has stopped going down and is making a series of higher lows since bottoming in May.
🟢 MRK has broken its longer-term downtrend going back over the last year.
🟡 MRK’s stock price is above its 50-day moving average, which is starting to turn higher. Next up, eyes are on the 200-day.
🟢 Momentum indicators are looking positive. The RSI has crossed above the mid-line again and has room to run. The MACD just flashed another bullish buy signal.
So the short-term is looking good, with upside targets to the 200-day moving average as a very distinct possibility. Downside risk is still roughly the same, but should find support at its recent trendline and 50-day moving average around the $79.50 level.
Can a longer-term perspective help confirm the turnaround?
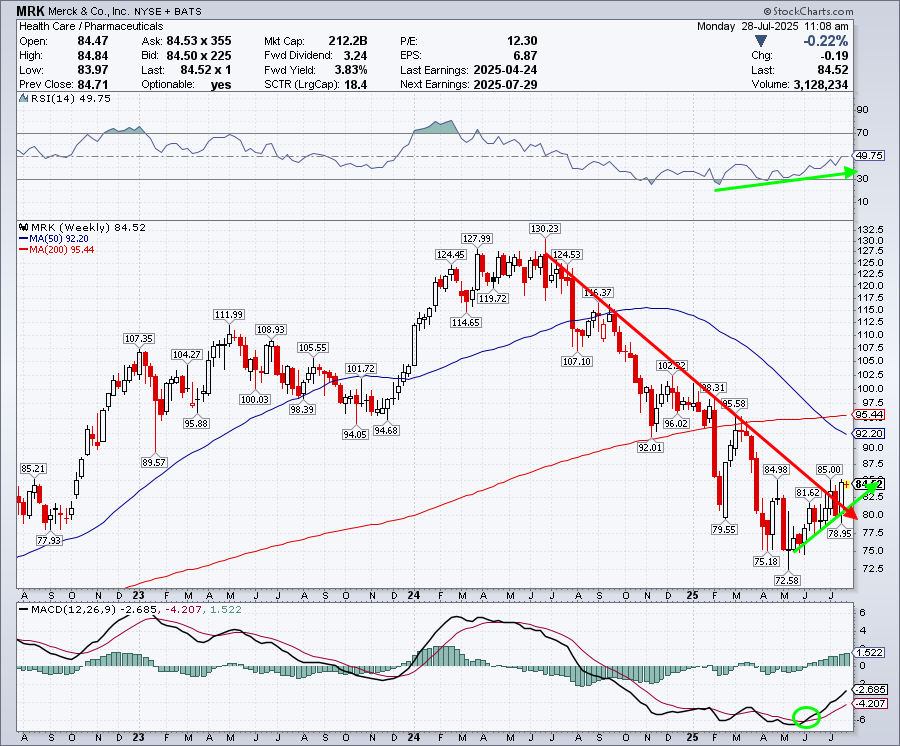
Again, we see lots of positives that make MRK look like a stock worth exploring from a risk/reward perspective.
✔️ Downtrend broken
✔️ New uptrend starting
❎ Above key weekly moving averages
✔️ Momentum indicators are positive
✔️ Looks positive across multiple time frames and has something to reverse
The Bottom Line
To summarize, stocks like those in focus this week — UPS, UNH, and MRK — take time to snap back, especially when they’ve been beaten down for so long.
- UPS is an example of a stock trying to find that bottom, but it may still have some work to do.
- UNH is more dangerous and involves much more risk; there is no technical sign of bottoming just yet.
- MRK gives traders the best scenario on all metrics and seems like the safer play of the group.
Not every bounce is a comeback, but with the right technical signals, you can improve your odds of catching one when it happens.