As Technology Loses Its Luster, What Stocks Should You Consider?

We don't know how long it's going to last, but technology (XLK) is not the same as it was just a couple of weeks ago. It was only two weeks ago that the XLK challenged its multi-month relative low vs. the S&P 500. What this tells us is that the strongest area of the market, the one area that's carried stocks back to all-time highs, has lost its relative momentum and is now trying to gain it back.
But will it?
I tend to give the bulls the benefit of the doubt, because history tells me that that's the smart thing to do. Investing is a whole lot easier if your investing "default" is to be long. The stock market does, however, send us warning signs from time to time, and that's when it's time to be more cautious, in my view. Any time technology stocks take a breather, we should be on notice. Technology represents more than 50% of the NASDAQ 100 (QQQ) and over 35% of the S&P 500 (SPY). If it's weak on a relative basis, the major indices are going to find it much more difficult to rally.
Take a look at where the XLK:$SPX ratio now sits. The relative PPO in the top panel shows us that this is the worst period of relative weakness for this group since the April 2025 low.
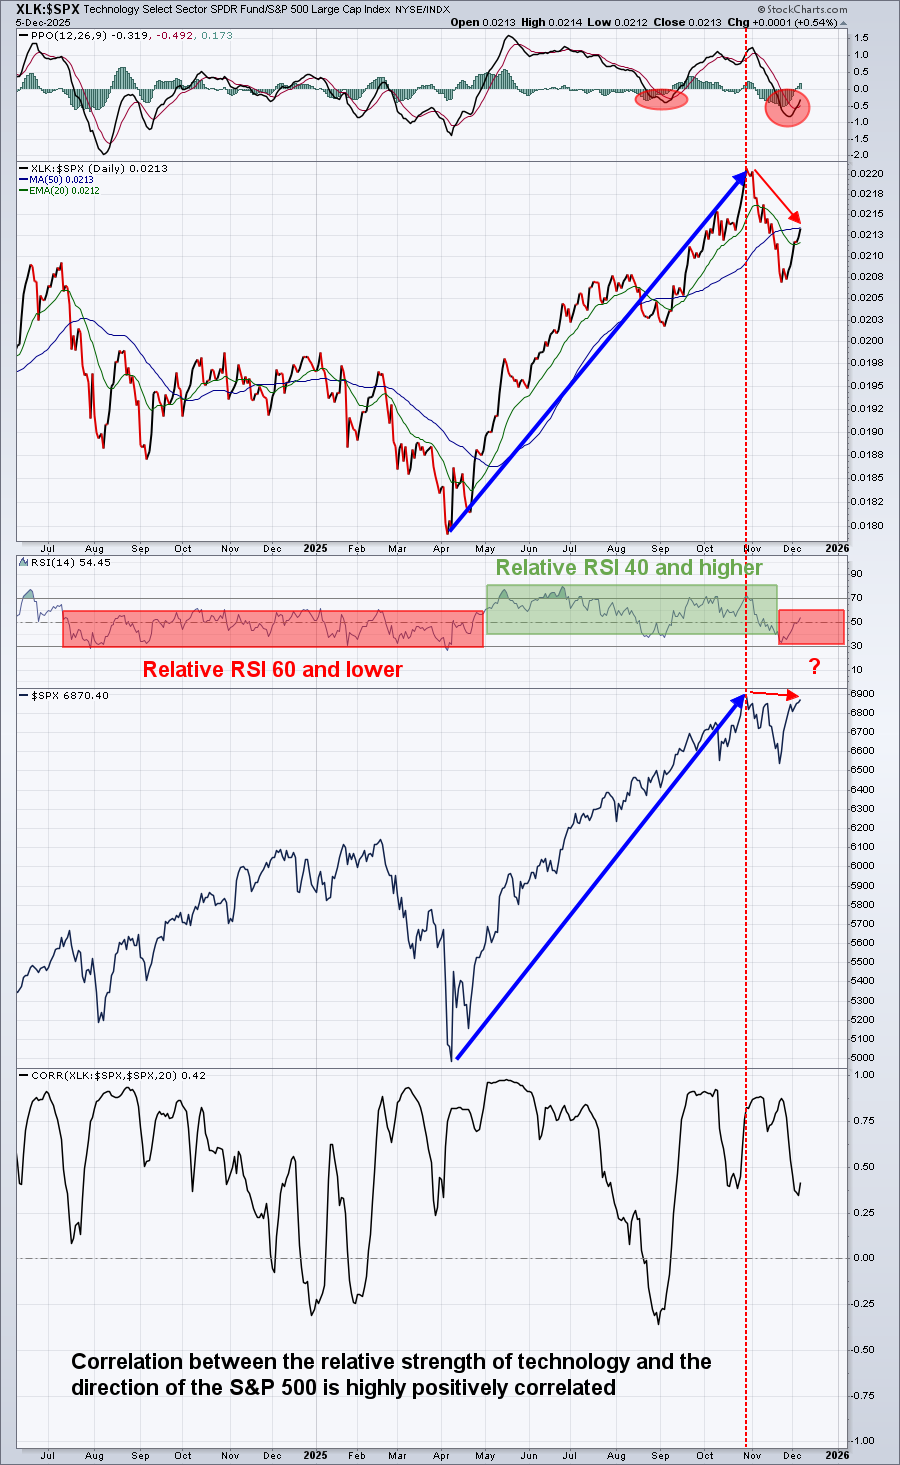
The bottom panel highlights the positive correlation between technology's relative strength and the direction of the S&P 500. This is only an 18-month chart, but if we stretch it out to 13 years, the duration of this secular bull market, not much changes. We occasionally see inverse, or negative, correlation, but we overwhelmingly see the positive correlation.
During 2024, the S&P 500 did manage to rise for several months while technology lagged. So until technology shows more leadership, it makes sense to look elsewhere for potential trades, but where?
Finding Strength Outside Technology
Well, it first depends on your strategy. There are plenty of leading stocks outside technology if you want to focus strictly on momentum and what's been working for awhile. Simply scanning for stocks outside technology with SCTR (StockCharts Technical Rank) scores above 75 or 80 would give you a great starting list. Another strategy might be to find other stocks that are just beginning to show absolute and relative strength, especially if it coincides with a recent earnings report.
Yeti Holdings (YETI) is a stock that fits the bill. I featured YETI in our FREE EB Digest newsletter after it reported excellent quarterly results, cleared a double top, and moved to an 11-month high. Its AD line was near a 52-week high and its relative strength is now soaring vs. its peer group. Here's the chart I sent out:
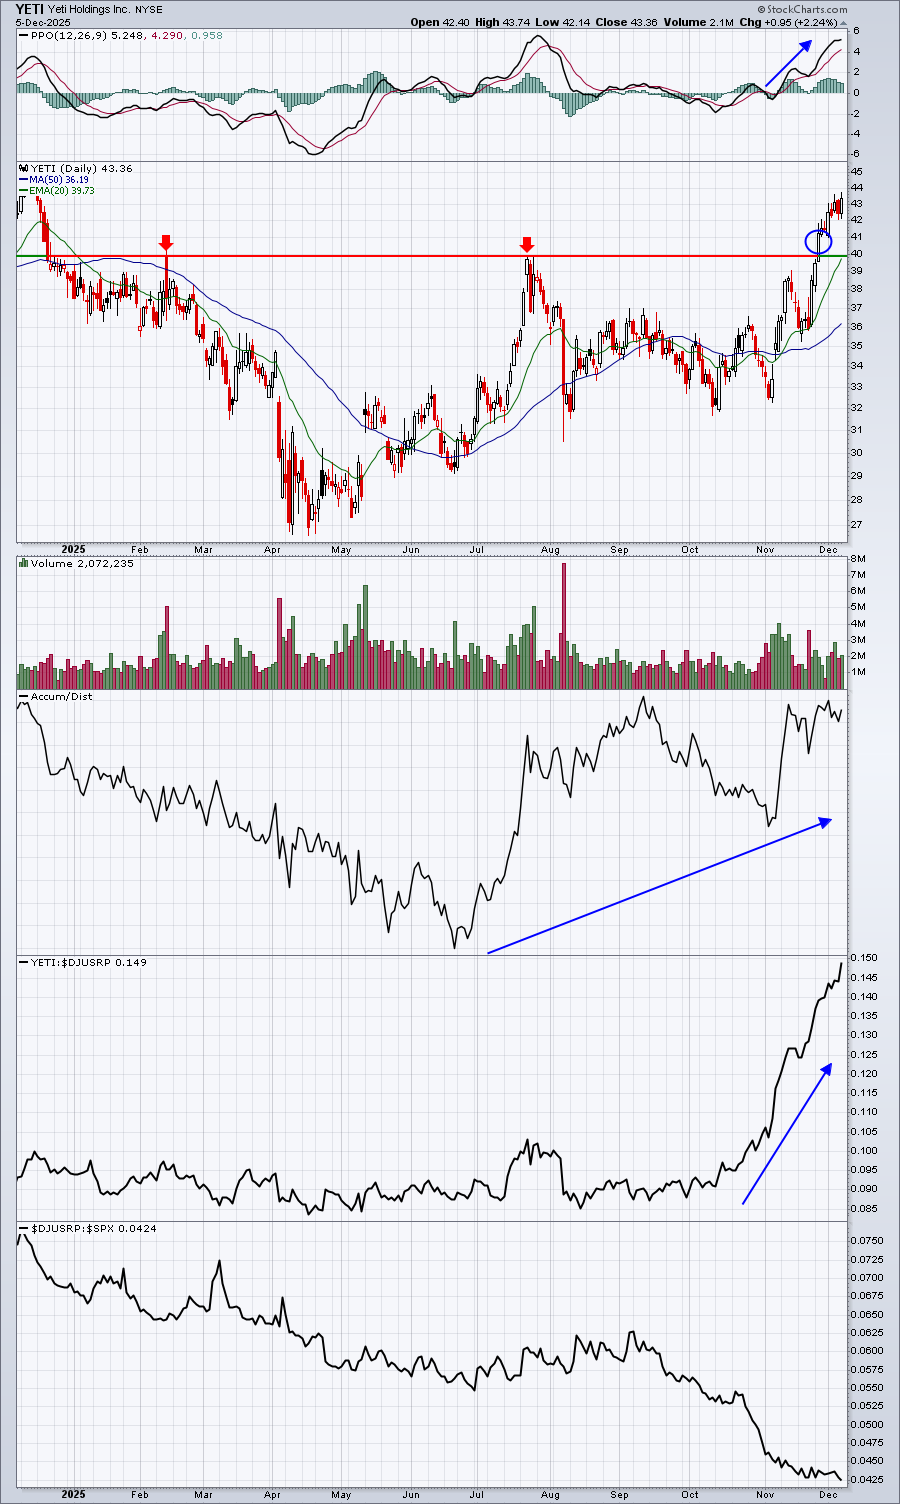
YETI has since moved higher and strengthened further vs. its peers.
Another discretionary stock that just broke out on Friday was Lululemon Athletica, Inc. (LULU). There remain a couple of question marks, but the recent improvement here is obvious:
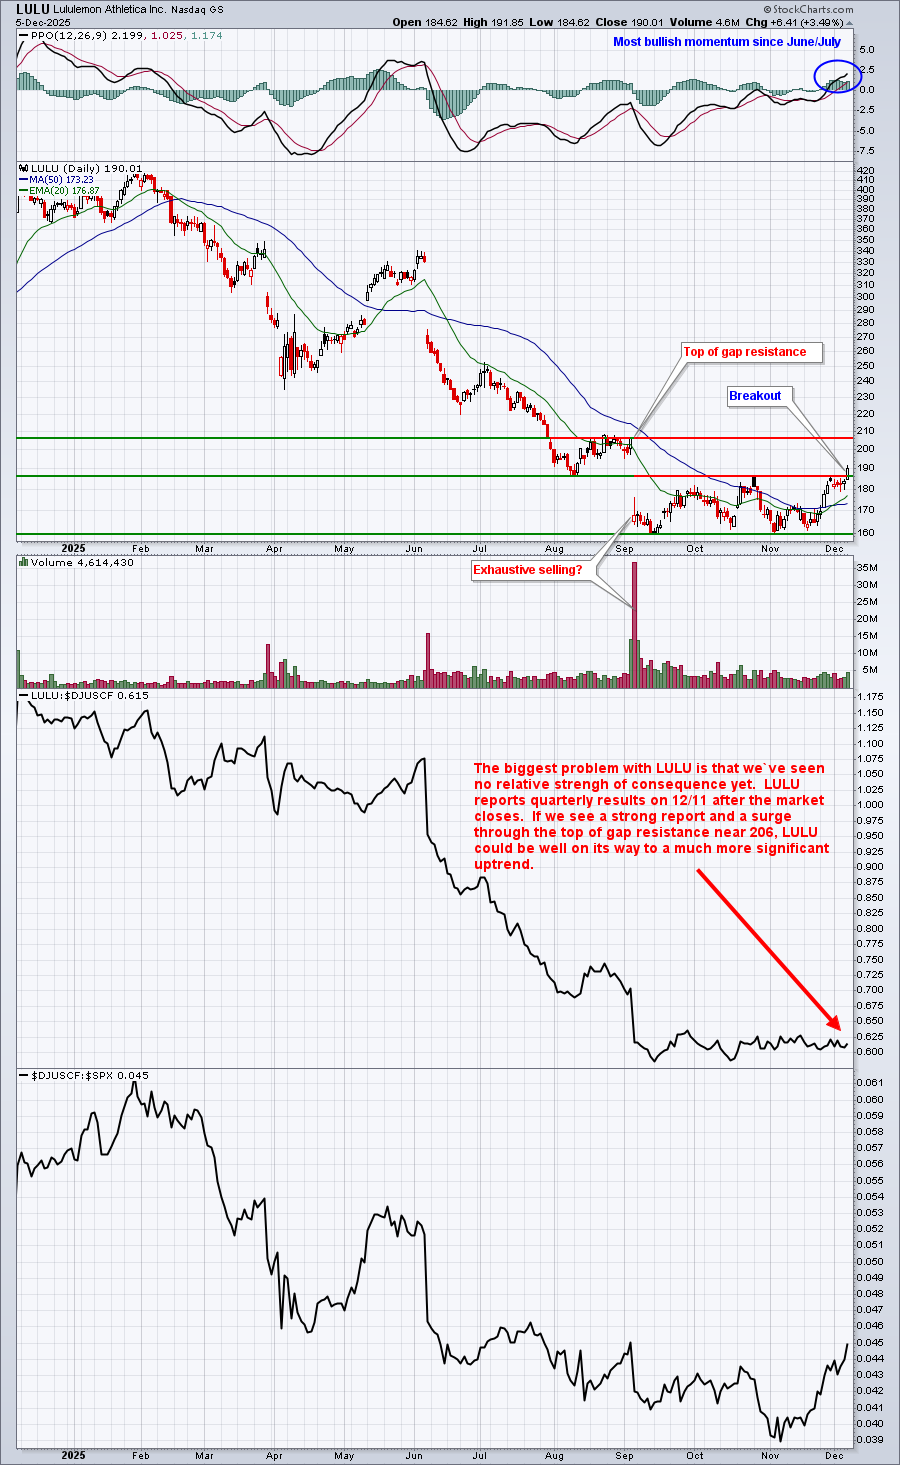
YETI appears to be much further along in its recovery, while LULU's turn back to the upside could just be beginning.
On Monday, I'm unveiling an industrial stock that had been wildly popular off of the April low, rising more than five-fold, but is now potentially being manipulated lower by market makers in order to accumulate shares for institutional clients. This stock is down more than 30% over the past six trading days and is now approaching very important gap and price support where I believe there's a very good chance for a major reversal. It's a volatile and risky stock, but one that could provide a huge return for those with a high tolerance of risk.
If you'd like to see this stock on Monday, simply CLICK HERE to sign up for our FREE EB Digest newsletter and join the tens of thousands who've already subscribed! Again, it's free and there's no credit card required!
Happy trading!
Tom


