Avoiding Confirmation Bias: Four Paths for the S&P 500 Into March

This week’s injection of volatility has investors appropriately considering the potential for a downside scenario as Q1 progresses. On our daily market recap show, we have been covering the general rotation away from growth leadership names into value-oriented sectors like Energy and Materials. And with market breadth conditions remaining fairly strong, the S&P 500 ($SPX) has generally avoided any significant drawdowns in 2026.
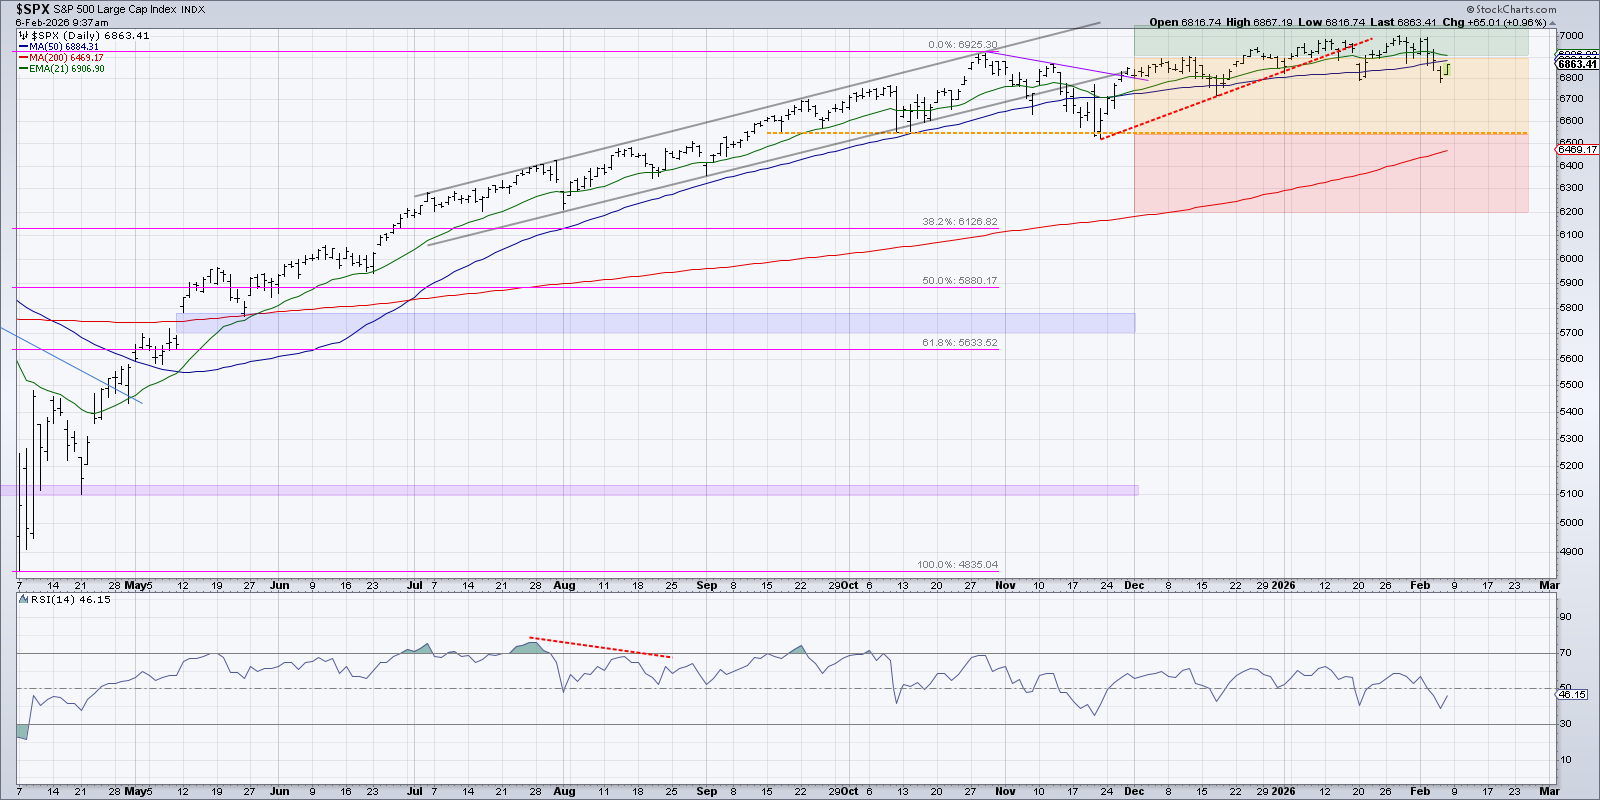
The S&P 500 experienced two pullbacks in January, both finding support at the 50-day moving average. This week, the S&P 500 once again closed below this short-term trend barometer, opening up the possibility of a more significant decline. From our perspective, the S&P 500 is now in neutral territory as long as it remains below 6900. And until and unless the SPX breaks below key support around 6550, based on the October and November lows and the 200-day moving average, we’re inclined to see this market as remaining in a generally bullish long-term structure.
It’s time again for one of my favorite exercises in “probabilistic analysis” where we lay out four different scenarios for a major index or ETF over the next six to eight weeks. And while it always feels good to have our thesis proven correct by the markets, this strategy is less about being right and more about being open to other opinions.
You see, from a behavioral perspective, it’s very easy to get locked into our own investment thesis. As a result, we mentally tune out other points of view, choosing instead to feel vindicated by any evidence or opinion that supports our own thesis. Behavioral finance calls this phenomenon “confirmation bias”, and we are going to work together today to avoid this behavioral pitfall by expanding our perspectives a bit!
Before we get to the chart of the S&P 500, let’s first go back to early December 2025, when we presented a similar exercise using the Nasdaq 100. Back then, we laid out four different potential outcomes into mid-January, from a 12% gain and a new all-time high for the Nasdaq to a 12% loss and a test of the 200-day moving average.
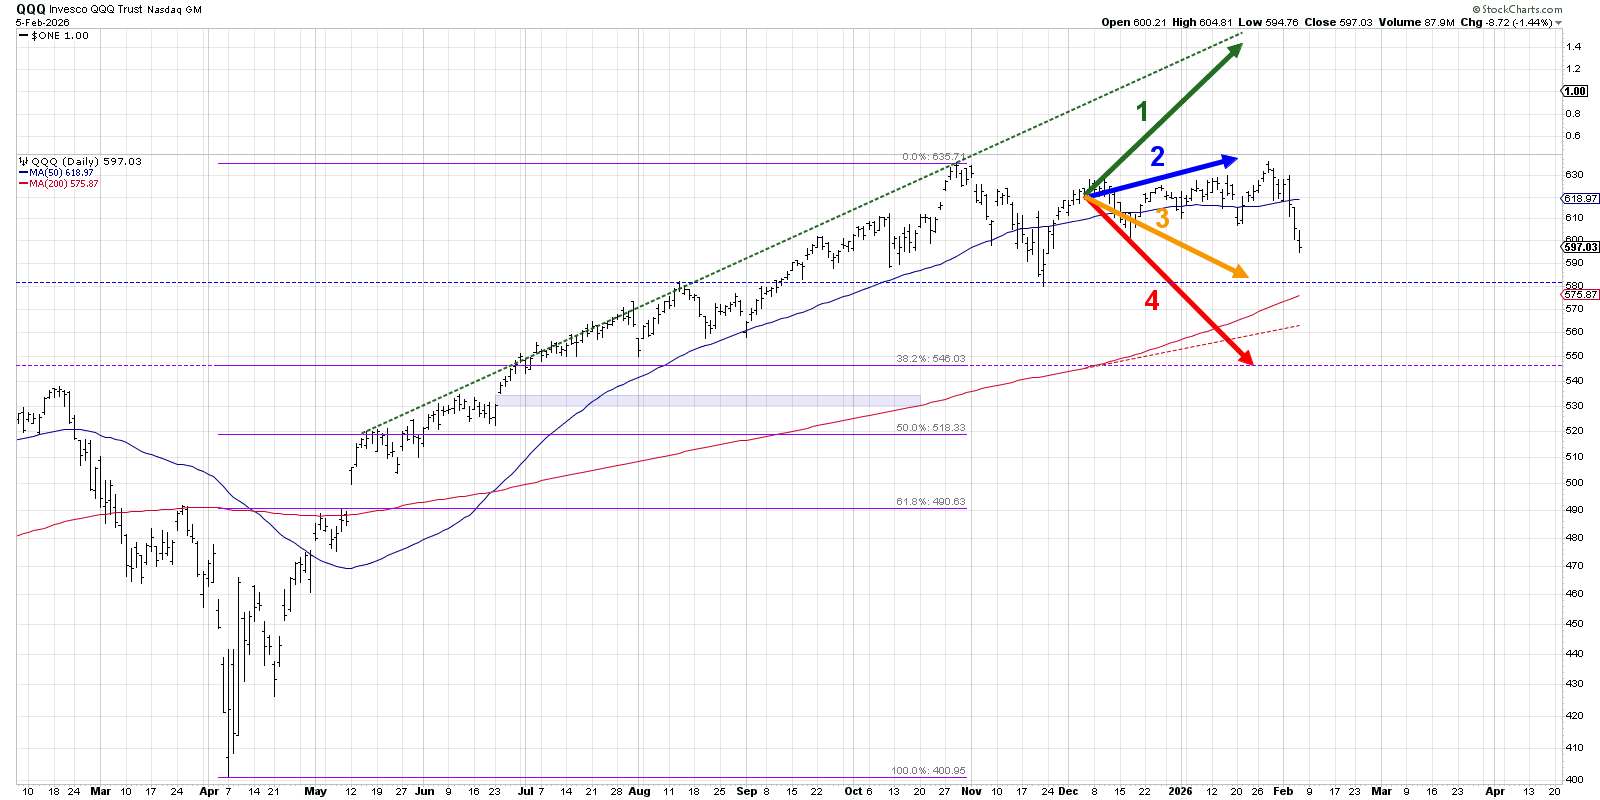
As you can see from the chart, a “2.5” vote would have been pretty much spot-on. Instead of experiencing any significant advance or decline, the QQQ essentially remained in a consolidation phase. And while this major growth-oriented ETF drifted slightly higher over our observation period, the price ended up almost exactly between scenarios 2 and 3.
Going back to the current markets, let’s review the four scenarios for the S&P 500 index between now and late March 2026. As a friendly remember, the point of this exercise is threefold:
- Consider all four potential future paths for the index, think about what would cause each scenario to unfold in terms of the macro drivers, and reflect on what signals/patterns/indicators would confirm the scenario.
- Decide which scenario you feel is most likely, and why you think that's the case. Don't forget to drop me a comment and let me know your vote!
- Think about how each of the four scenarios would impact your current portfolio. How would you manage risk in each case? How and when would you take action to adapt to this new reality?
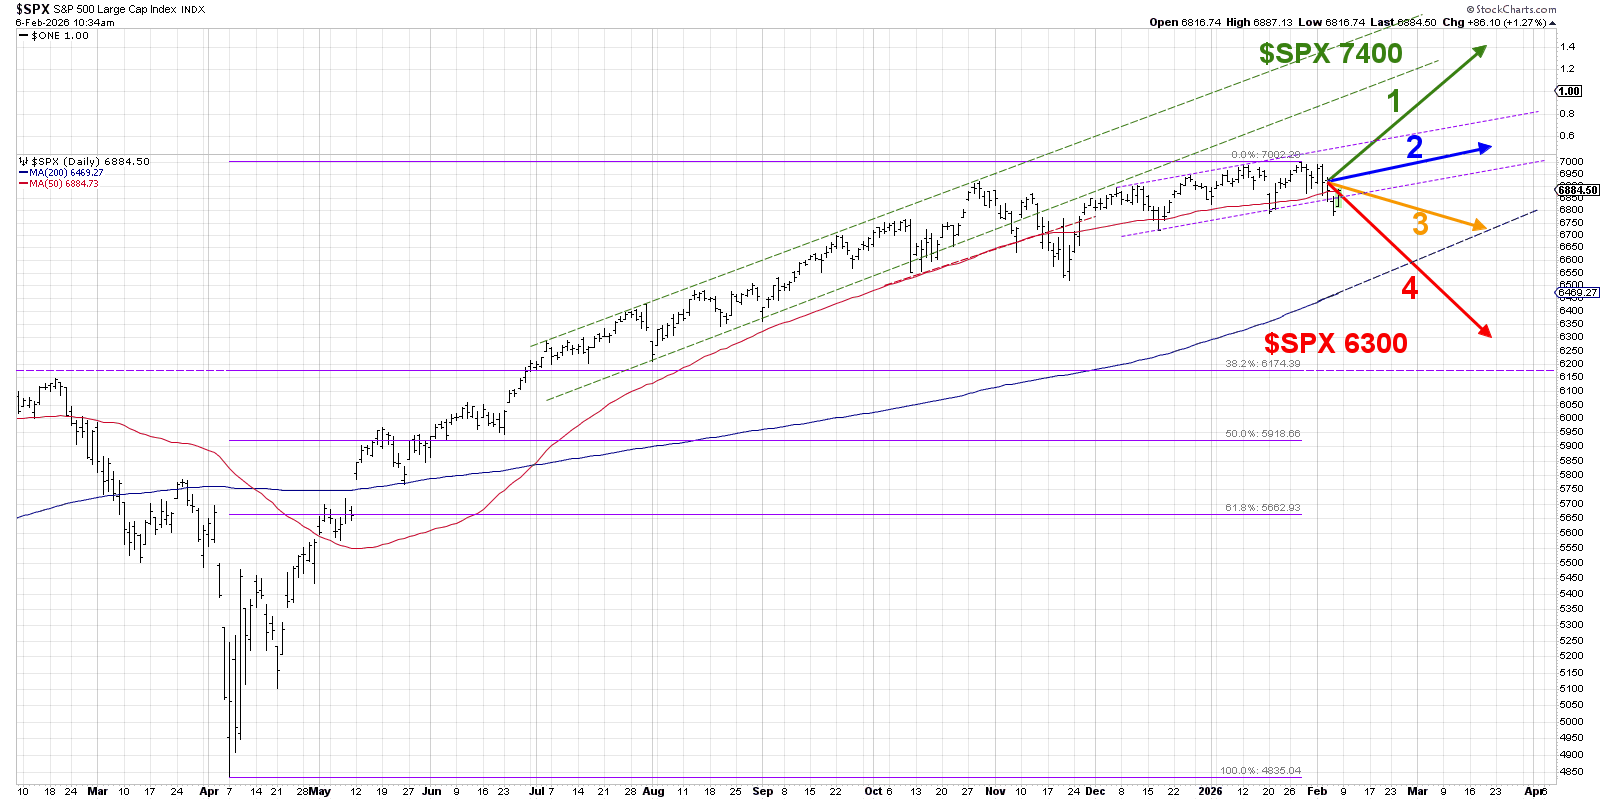
Here’s the chart we’ve created to illustrate the four scenarios. You’ll find a breakdown of each scenario below, along with the probability I’ve assigned for each scenario. Disagree with me? Jump over to my YouTube channel and drop a comment — tell me why I’m wrong!
Let’s start with a super bullish outcome, where the S&P 500 index shrugs off recent weakness and the Great Bull Market of 2025 resumes!
Option 1: The Super Bullish Scenario
The break below the 200-day moving average in November served as a major wake-up call for the bulls, but the S&P 500 quickly recovered and settled into a low-volatility uptrend phase. While the pace of the advance was slower than in the summer of 2025, the SPX returned to a short-term pattern of higher highs and higher lows.
The leadership rotation away from mega-cap growth stocks has been the biggest weight on the current market. So what if the uptrend resumes, driven by an impressive recovery in struggling charts like MSFT, META, and AMZN? Should the Magnificent 7 stocks return into a leadership role, they represent enough weight in the S&P 500 that new all-time highs would be a no-brainer. 7000 would be just the beginning, as the SPX returns to a strong uptrend phase driven by growth stocks, and other names would just be along for the ride.
Dave’s Vote: 5%
Option 2: The Mildly Bullish Scenario
While a full recovery to the Great Bull Market of 2025 seems unlikely to me, a more reasonable outcome could be simply a continuation of the bullish trend we’ve observed so far in 2026. This new bull phase has occurred despite the general weakness in mega-cap growth stocks, as value sectors like materials and industrials have experienced impressive gains.
This second scenario would mean “more of the same” with value-oriented sectors continuing to outperform, but without any bearish signs of rotation to more defensive sectors like real estate. Economic data in this scenario would need to remain fairly constructive, because we saw this week what happened to the S&P when the latest jobs data came in below expectations.
Dave’s vote: 20%
Option 3: The Mildly Bearish Scenario
What if this week’s spike in volatility is just the beginning of a revaluation for the equity markets? If mega-cap growth stocks continue to struggle, and the major indexes begin to break down in earnest, then we could see a rotation to more defensive sectors. The S&P 500’s 200-day moving average will probably be around 6700 by late March, and a test of the 200-day would mean the first major challenge to this bull market since November.
Weaker economic data could certainly be a part of this mildly bearish scenario, and the astronomical spending on AI infrastructure leaves investors struggling to justify current valuations. Breadth data most likely goes negative into March, and precious metals become a safe haven once again for rattled equity investors.
Dave’s vote: 45%
Option 4: The Super Bearish Scenario
Every exercise needs a doomsday scenario, and this time we’ll lay out a potential path to S&P 6300 by late March. Everything in scenario three is still true, except the reaction is more severe. Credit spreads widen as bond investors become more skeptical of a market recovery, and a pop higher in the VIX shows that the options market is pricing in much higher price swings for the S&P 500.
In this super bearish outcome, the SPX would be unable to hold the 200-day moving average, and the index accelerates lower into March as investors come to realize that dip buyers are no longer coming in to save the bull market. A feedback loop commences, as weaker price action leads to further bearishness, leading to even further drops in price.
Dave’s vote: 30%
What probabilities would you assign to each of these four scenarios? Check out the video below, and then drop a comment with which scenario you select and why!
RR#6,
Dave
P.S. Ready to upgrade your investment process? Check out my free behavioral investing course!
David Keller, CMT
President and Chief Strategist
Sierra Alpha Research
Disclaimer: This blog is for educational purposes only and should not be construed as financial advice. The ideas and strategies should never be used without first assessing your own personal and financial situation, or without consulting a financial professional.
The author does not have a position in mentioned securities at the time of publication. Any opinions expressed herein are solely those of the author and do not in any way represent the views or opinions of any other person or entity.


