Bearish Reversal for QQEW, New Highs Surge as Low Vol Leads, Strength in EW Sectors
Money is moving out of Nasdaq 100 stocks and into more mundane parts of the stock market. And it's not just a few large-caps in QQQ; we are seeing weakness throughout as the Nasdaq 100 Equal-Weight ETF (QQEW) formed and confirmed a large bearish reversal pattern. Movement away from high volatility is confirmed with relative strength in the S&P 500 Minimum Volatility ETF (USMV) and its underlying components.
Key Takeaways
- Nasdaq 100 Equal-Weight ETF triggers long-term trend signal.
- New highs expand with low volatility stocks leading.
- 8 of 11 equal weight sectors up as old school stocks lead.
QQEW Triggers Long-term Trend Signal
No matter how you slice it, the Nasdaq 100 Equal-Weight ETF (QQEW) reversed its long-term uptrend. While the large-cap weighted QQQ has yet to break down, the breakdown in QQEW reflects broad weakness within the Nasdaq 100.
The chart below shows QQEW forming a classic Double Top from October to January and breaking intermittent support for confirmation. These are bearish reversal patterns that mark a distribution period and a material increase in selling pressure. Sideways price action marks the distribution, while the plunge below the demand line (support) shows a sharp increase in selling pressure (supply). The bears are now in control of this trend.
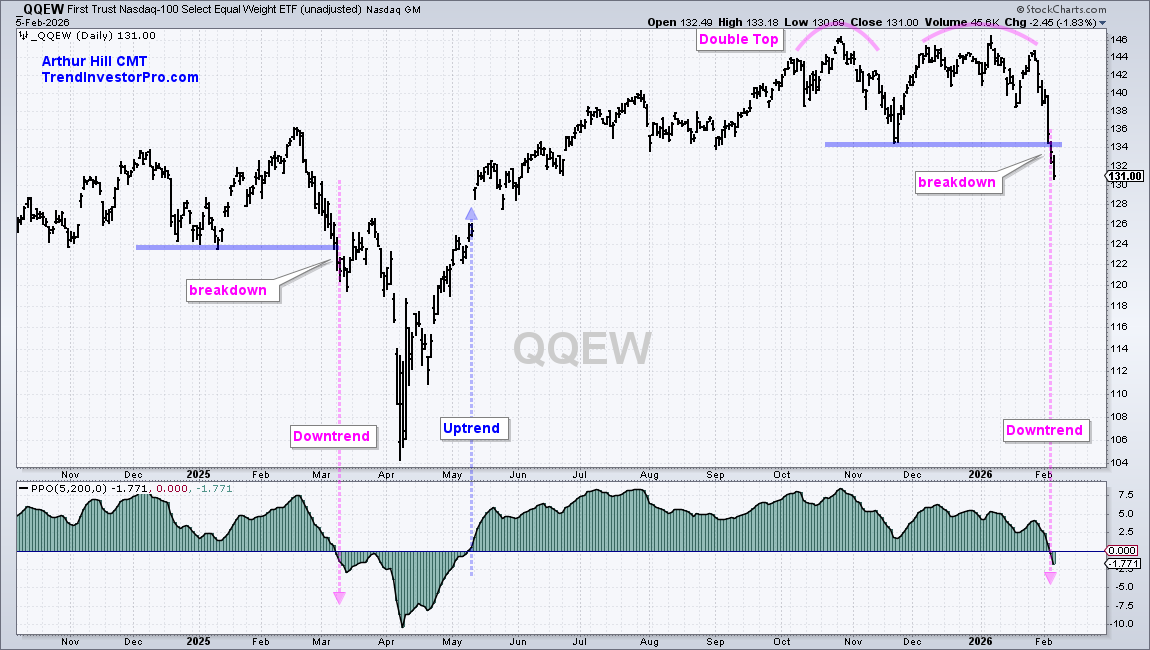
The bottom window shows the PPO(5,200,0), which is the percentage difference between the 5- and 200-day EMAs. This indicator can confirm chart signals. Pink and blue arrows mark the trend signals over the last 15 months. Note that PPO confirmed the Double Top as it crossed into negative territory this week.
TrendInvestorPro set key levels for SPY, QQQ, and XLK over the last few weeks. Two of the three broke these key levels this week. Click here to learn more.
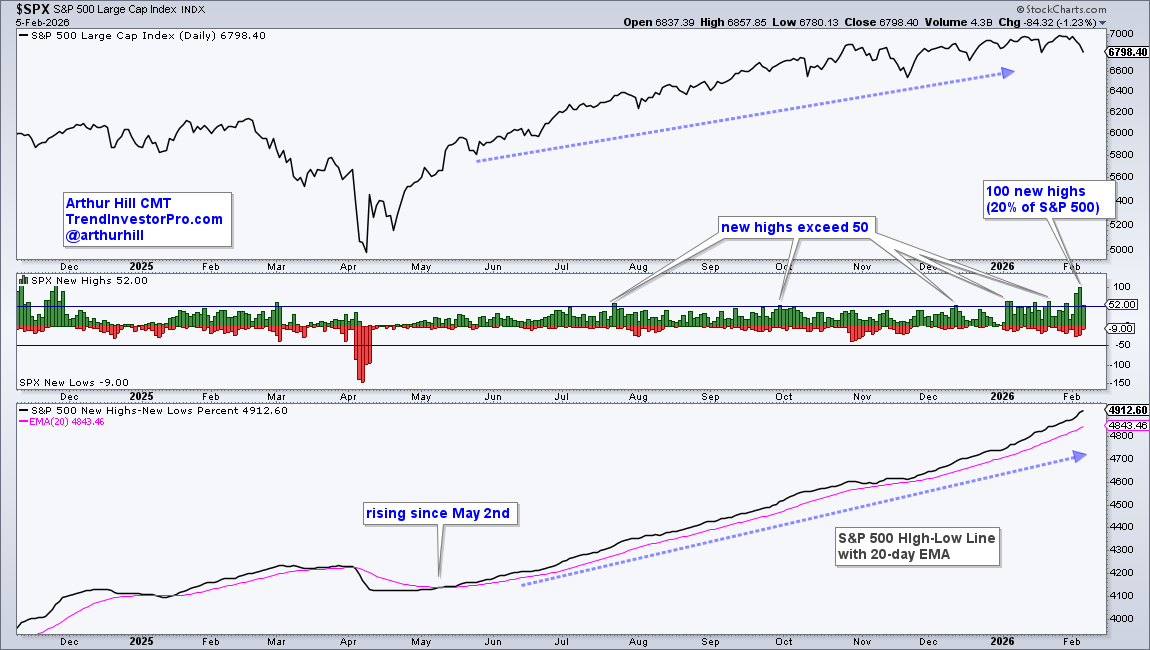
100 New Highs in the S&P 500
Money is clearly moving into other areas of the stock market. Note that 100 stocks in the S&P 500 recorded new highs on Wednesday (!NEWHISPX). That's 20% of the index! The bottom window shows the S&P 500 High-Low Line rising throughout 2026 as new highs outpace new lows this year.
Low Volatility Stocks Hold Up
In a broad sense, money is moving into stocks with relatively low volatility. The chart below shows the S&P 500 Minimum Volatility ETF (USMV) hitting new highs as it breaks out of a triangle consolidation. This is a diversified ETF that holds stocks with relatively low volatility. The bottom window shows the PPO(5,200,0) turning positive in late April and remaining positive. USMV is still in an uptrend.
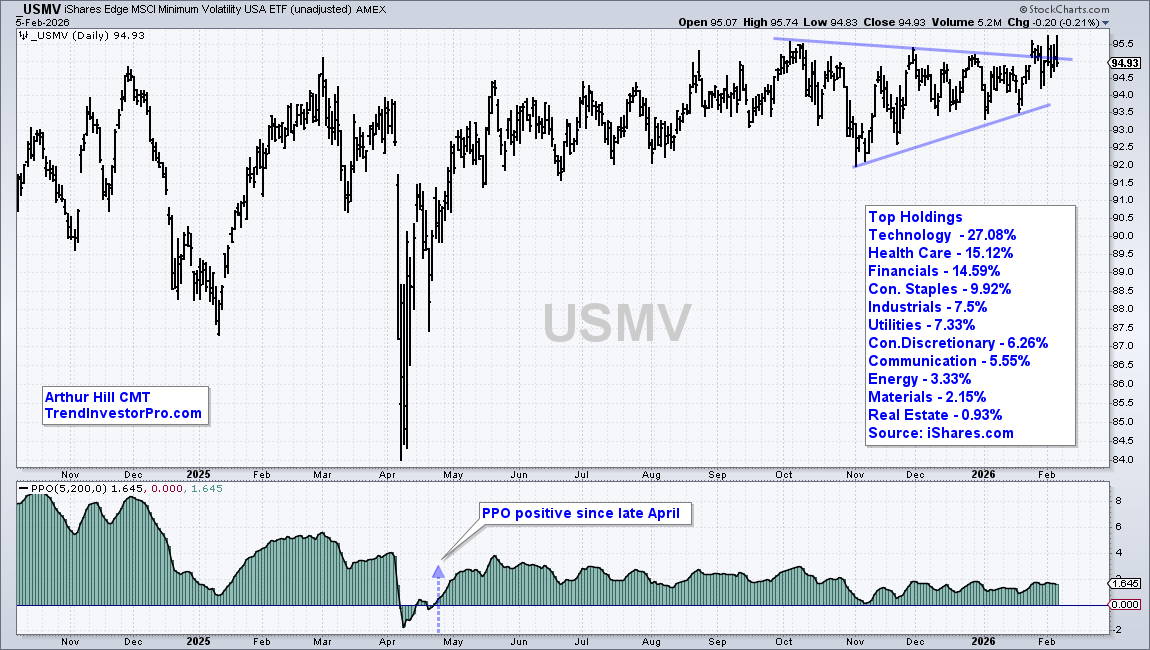
Note that USMV is not the most exciting ETF and probably ill-suited for generating big returns. After all, it is virtually unchanged since mid-May. Unchanged, however, looks pretty good when compared to QQEW.
The table on the chart shows the top sector holdings within USMV. Surprisingly, tech is the top sector!
Recent reports and videos at TrendInvestorPro:
- Key Levels for SPY, QQQ, and XLK (two were broken)
- Setups Outside of Tech: Housing Finance, Healthcare, and India
- Setups for a Homebuilder and Medical Device stocks
- First support and an oversold indicator to watch for Gold
Click here to take a trial and gain full access.
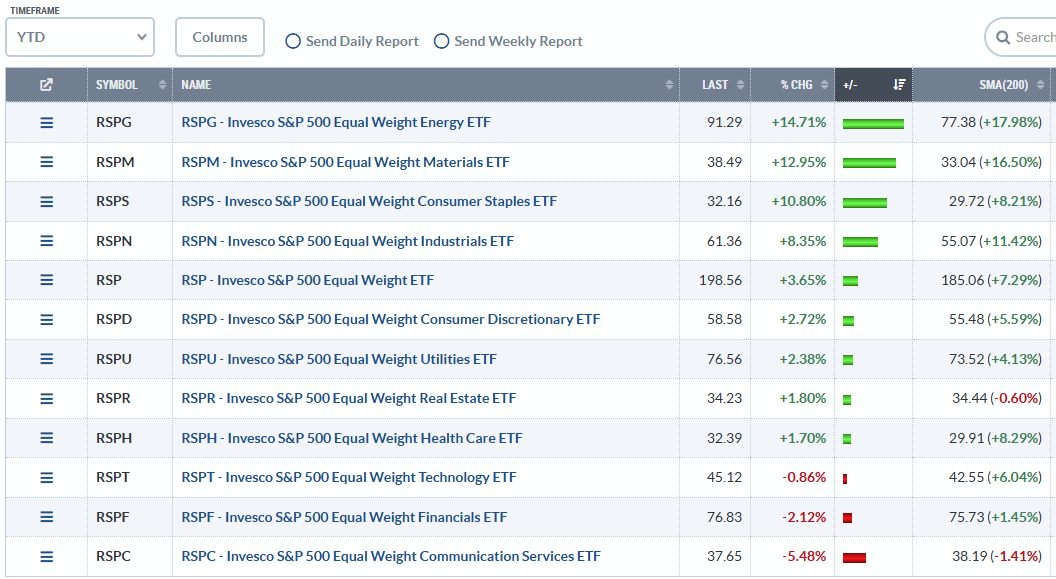
8 of 11 Equal Weight Sectors are Up
The table below ranks year-to-date performance for the 11 equal-weight sectors and the S&P 500 EW ETF (RSP). RSP is up 3.65% so far this year, versus a 0.63% loss for SPY and a 2.81% decline for QQQ. Eight of the 11 equal-weight sectors are up with energy, materials, staples, and industrials leading the way. At the bottom, we see tech (-.86%), financials (-2.12%) and communication services (-5.48%). Equal-weight tech is holding up much better than the large-cap-dominated Technology SPDR (XLK), which is down 5.79% this year.
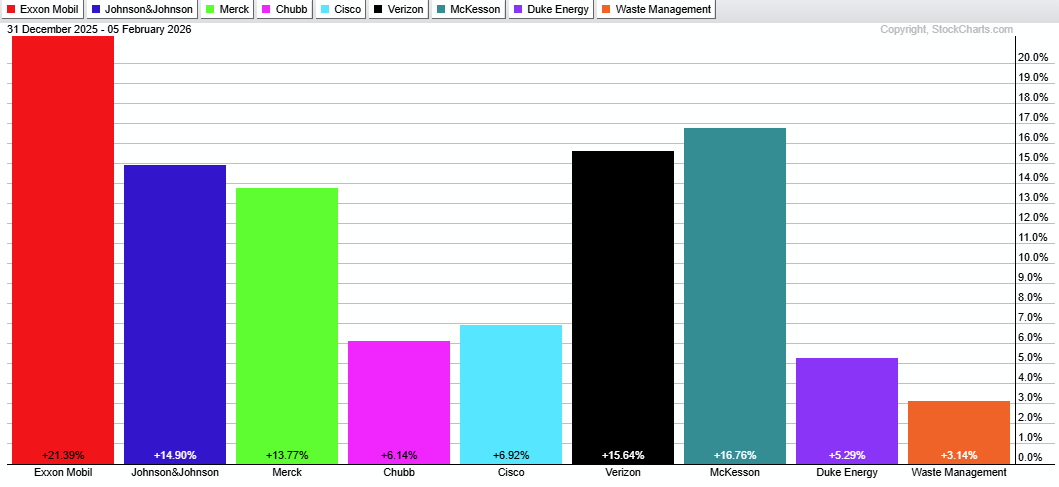
Leaders are as Old School as it Gets
The top 10 holdings for USMV are as old school as it gets. Among others, we have energy giant ExxonMobil (XOM), big pharma stocks Johnson & Johnson (JNJ) and Merck (MRK), insurer Chubb (CB), and telecom provider Verizon (VZ). Cisco (CSCO) is a tech stock that survived the dotcom era. These stocks are up year-to-date.
The broadening theme started in late November when we saw breakouts in Industrials (XLK), Materials (XLB), Retail (XRT), and Banks (KRE). This theme remains in place until proven otherwise. A low volatility theme emerged (risk off). I do not know how long these themes will remain valid, but this is the way to trade until the evidence changes.
See TrendInvestorPro for more reports and videos.


