The Best Five Sectors This Week, #41
Key Takeaways
- S&P 500 picked up over 1% in the week ending October 17
- Technology maintains top position, Utilities jump to #2
- Industrial sector showing weakness within top 5
- Portfolio performance lags S&P 500 by 10% due to drag by equal weighting
The Top 5 Shuffle
The composition of the top five sectors remains unchanged, but we're seeing some shifts in positioning. Technology continues to hold the crown at number one, no surprises there.
However, the big story this week is Utilities, which has made an impressive leap from fourth to second place. This jump has consequently pushed Communication Services and Consumer Discretionary down to third and fourth positions, respectively. Industrials, meanwhile, remain static at number five.
In the bottom half of the rankings, we see Health Care edging up to sixth from seventh, swapping places with Financials. Materials, Energy, Real Estate, and Consumer Staples are holding steady at their previous positions.
- (1) Technology - (XLK)
- (4) Utilities - (XLU)*
- (2) Communication Services - (XLC)*
- (3) Consumer Discretionary - (XLY)*
- (5) Industrials - (XLI)
- (7) Healthcare - (XLV)*
- (6) Financials - (XLF)*
- (8) Materials - (XLB)
- (9) Energy - (XLE)
- (10) Real-Estate - (XLRE)
- (11) Consumer Staples - (XLP)
Weekly RRG
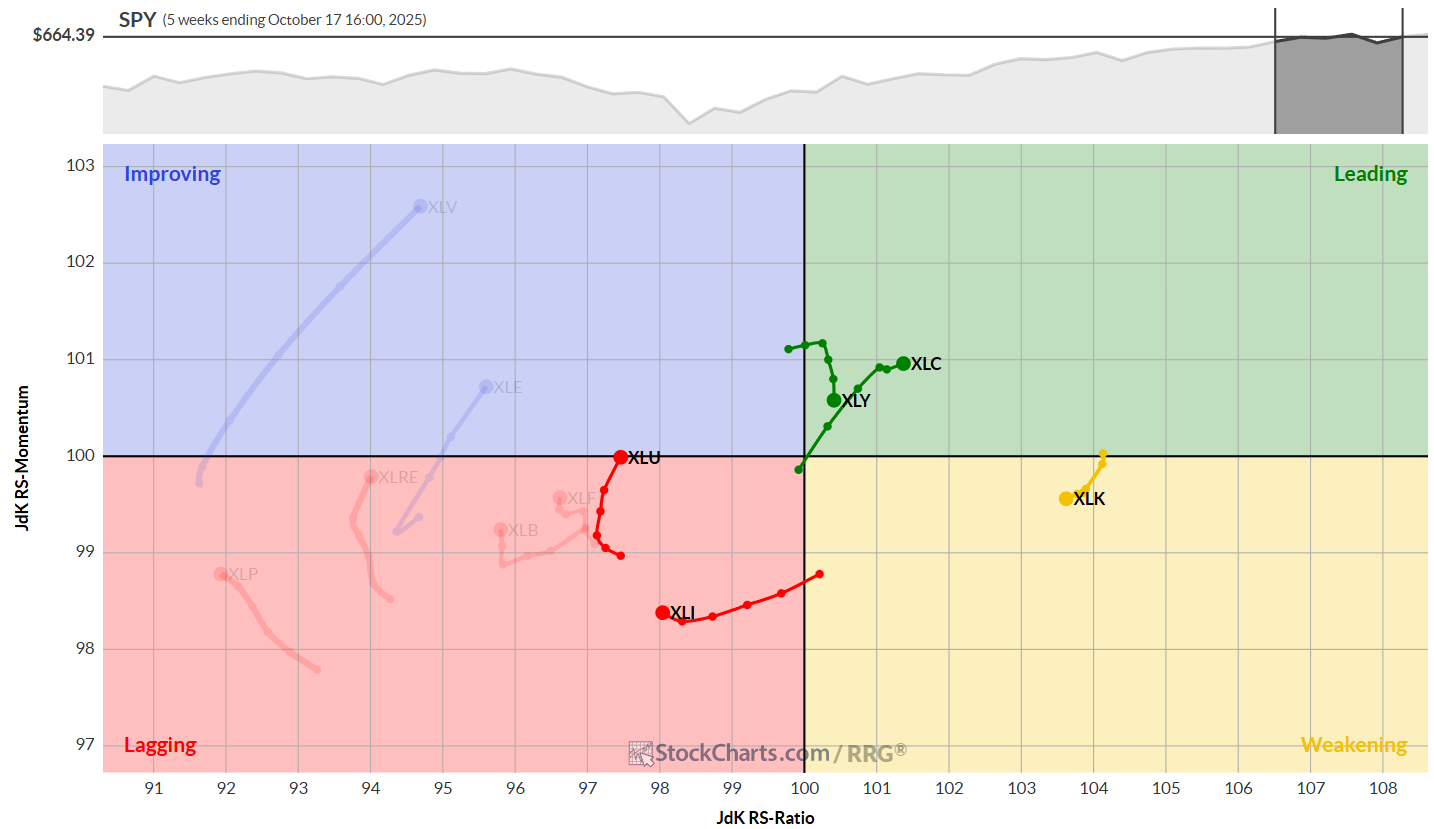
The weekly Relative Rotation Graph (RRG) paints a picture of continued rotation favoring the top five sectors. Here's what's catching my eye:
- Technology maintains its dominance with the highest RS-Ratio.
- Communication Services is regaining positive momentum.
- Consumer Discretionary remains in the leading quadrant but is losing some steam.
- Utilities are on the verge of pushing into the improving quadrant.
- Industrials seem to have bottomed out and are slowly — emphasis on slowly — starting to curl back up within the lagging quadrant.
Daily RRG
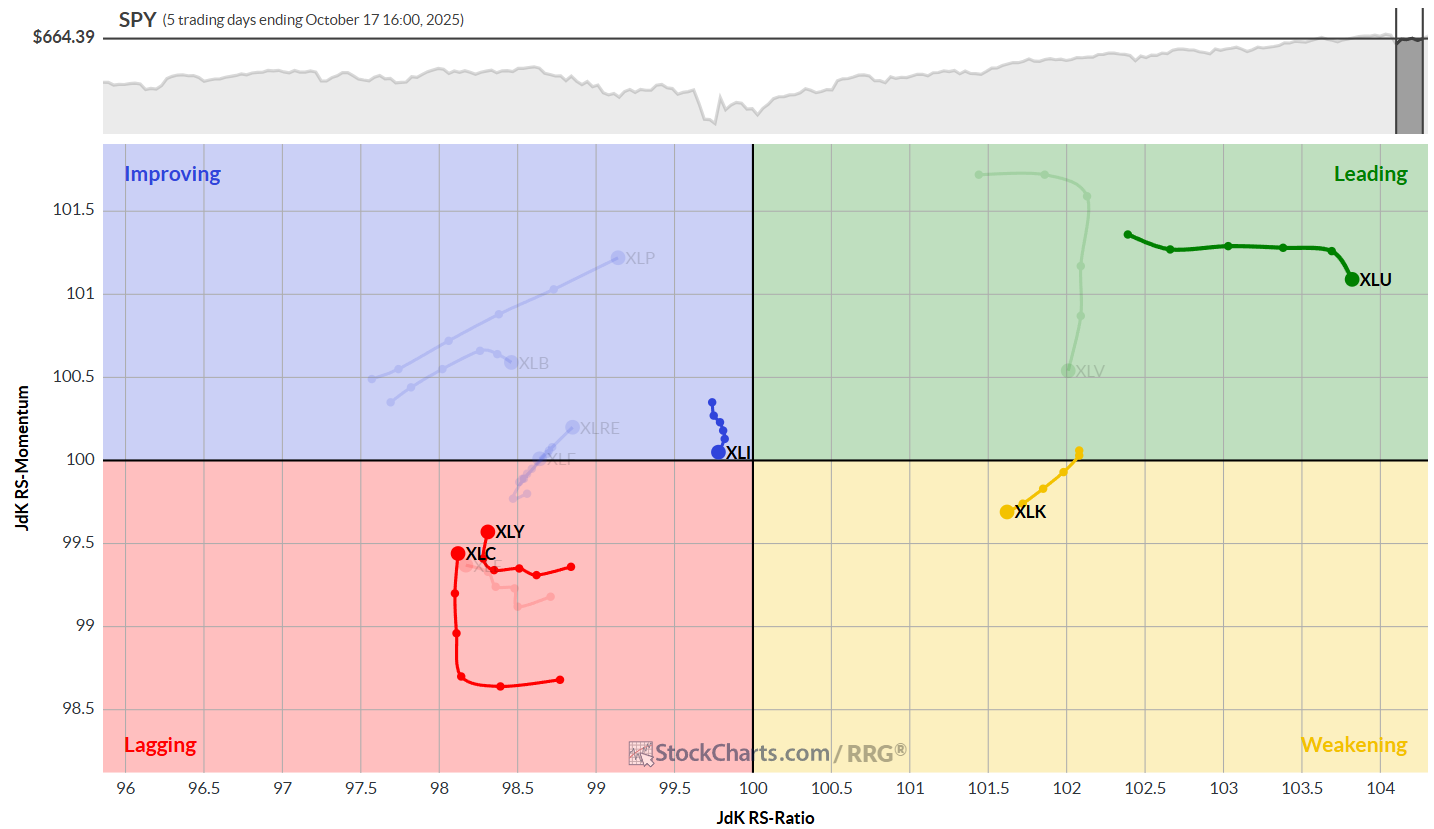
Switching to the daily RRG, we get a more granular view of recent sector movements:
- Utilities are showing remarkable strength, sitting high on the RS-Ratio scale.
- Technology is rotating through the weakening quadrant but remains one of the stronger sectors.
- Communication Services and Consumer Discretionary are in the lagging quadrant but picking up relative momentum.
- Industrials are rotating lower within the improving quadrant, almost crossing back into lagging territory.
This daily view aligns with the weekly positioning for most sectors, with Industrials as the notable exception, and potentially the weak link in our top five.
Technology
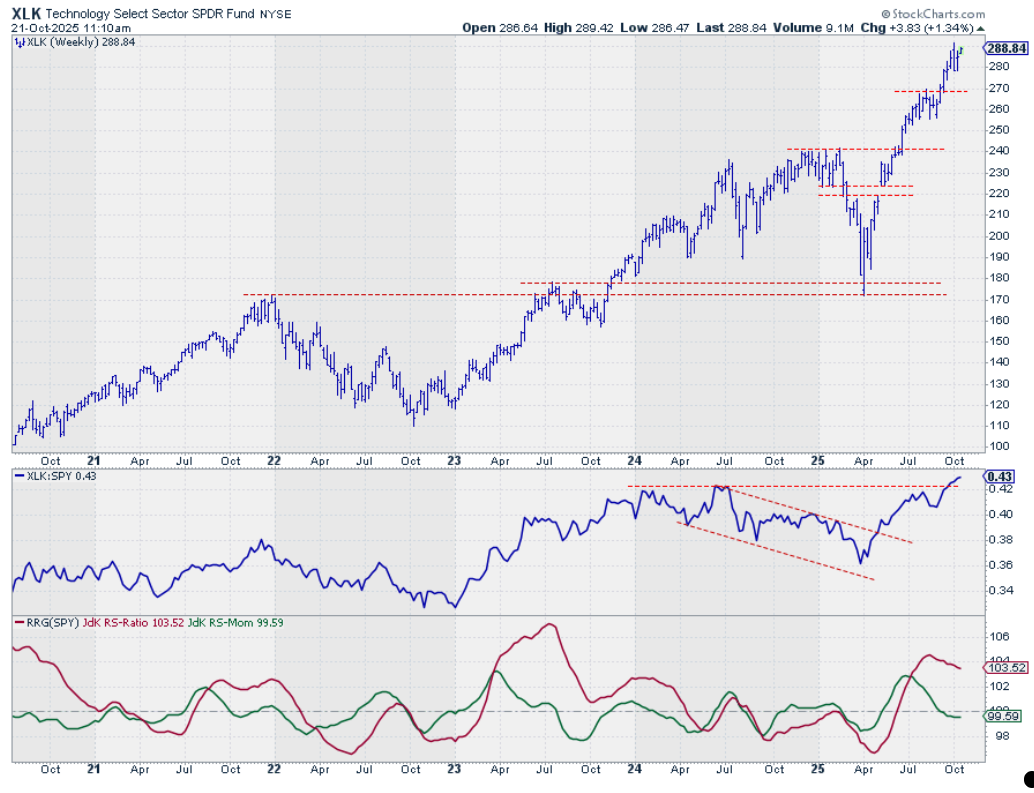
The tech sector's price chart is maintaining a clear uptrend.
After a brief dip last week, we're seeing continued strength at the start of this week. The raw RS line is holding well above its breakout to new highs, resulting in RRG lines that position the weekly tail in the weakening quadrant.
However, with the RS-Ratio still comfortably above 100 and RS-Momentum leveling off, tech's dominance seems secure for now.
Utilities
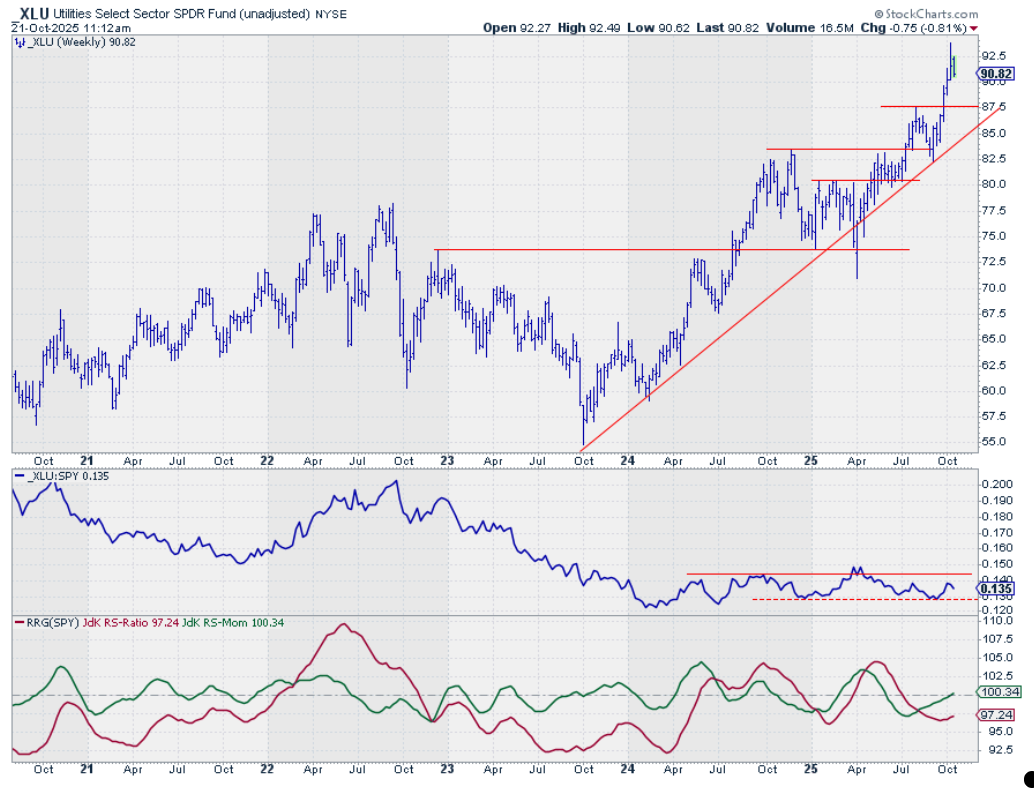
Utilities have made the most significant jump in the rankings this week.
We're seeing a continued rally in price, with the RS line moving well off its lower boundary. This is pulling the RRG lines up, with the RS-Momentum line crossing above 100 and positioning the sector in the improving quadrant.
Keep an eye on this sector, it's showing some serious potential. But it's current strength as the most defensive sector may be a warning sign for the market as a whole.
Communication Services
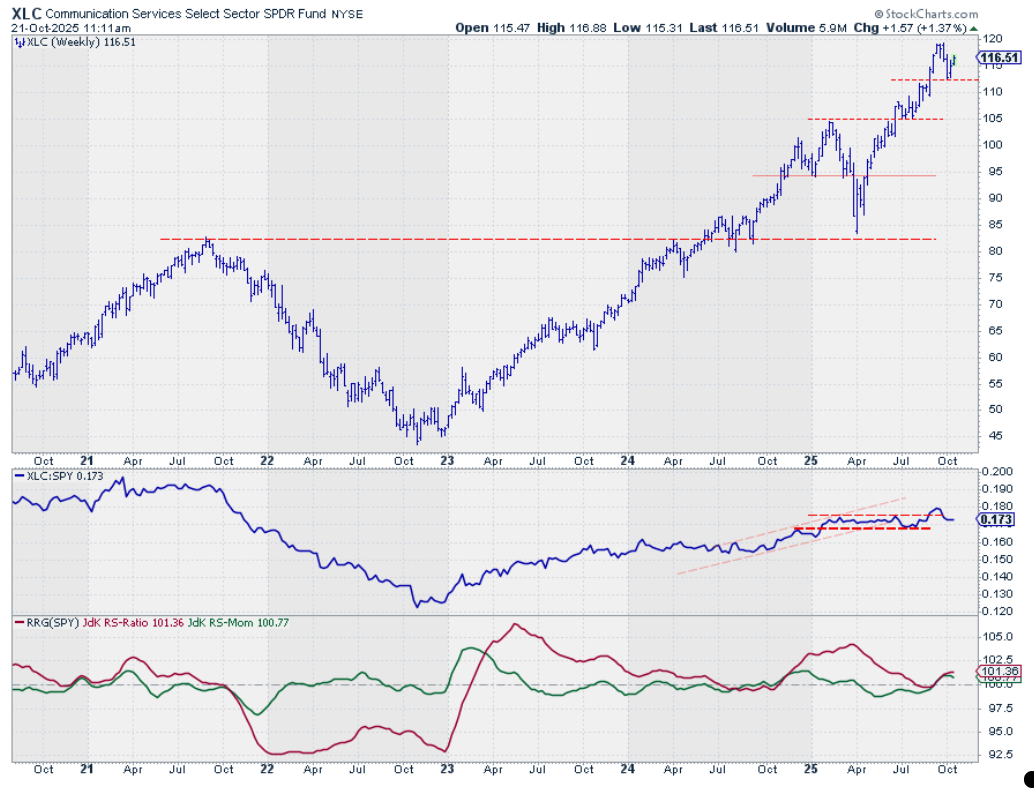
At number three, Communication Services is putting in work. The price chart shows a new higher low, which is a positive sign.
We'd need to see more convincing relative strength in the coming weeks to confirm a higher low in the raw RS line, but the positioning inside the leading quadrant on the RRG is promising.
Consumer Discretionary
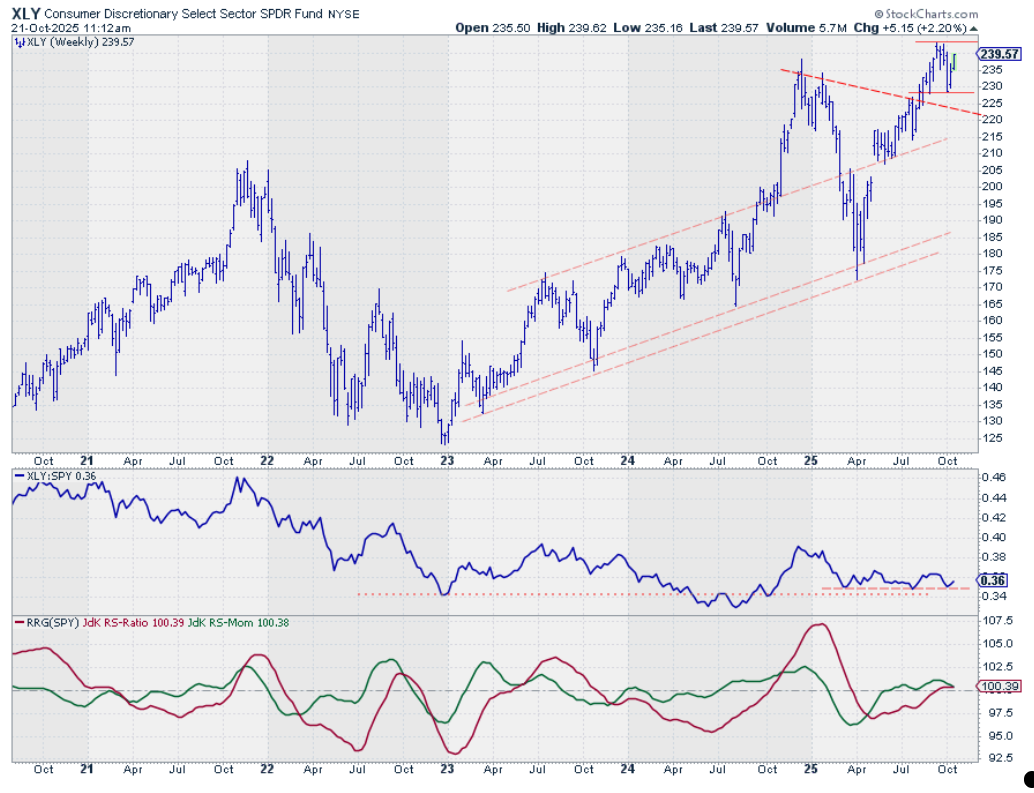
Consumer Discretionary appears to be forming a new low, with prices rising for two consecutive weeks. It's approaching the $240 barrier, which will be the next level of resistance to watch.
The raw RS line has bottomed against previous lows, forming clear support. This could drag both RRG lines higher and further into the leading quadrant over time.
Industrials
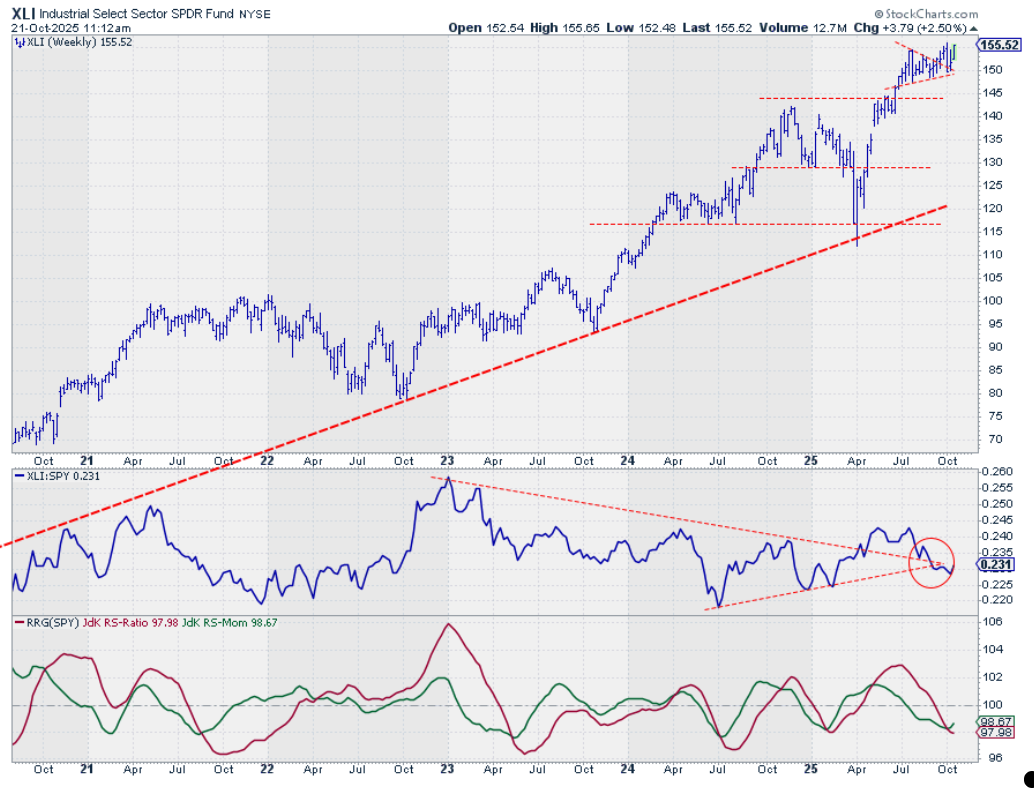
The Industrial sector is looking a bit messy. We've seen a breakout from a flag-like pattern, followed by a dip back into the formation and a subsequent bounce.
While this recent bounce is positive, especially if we can take out the recent high around $1.57, the relative strength is concerning.
The RS line is dropping below its rising support and former falling resistance, pushing the RRG lines further below 100. This makes Industrials the most vulnerable sector in our top five at the moment.
Portfolio Performance
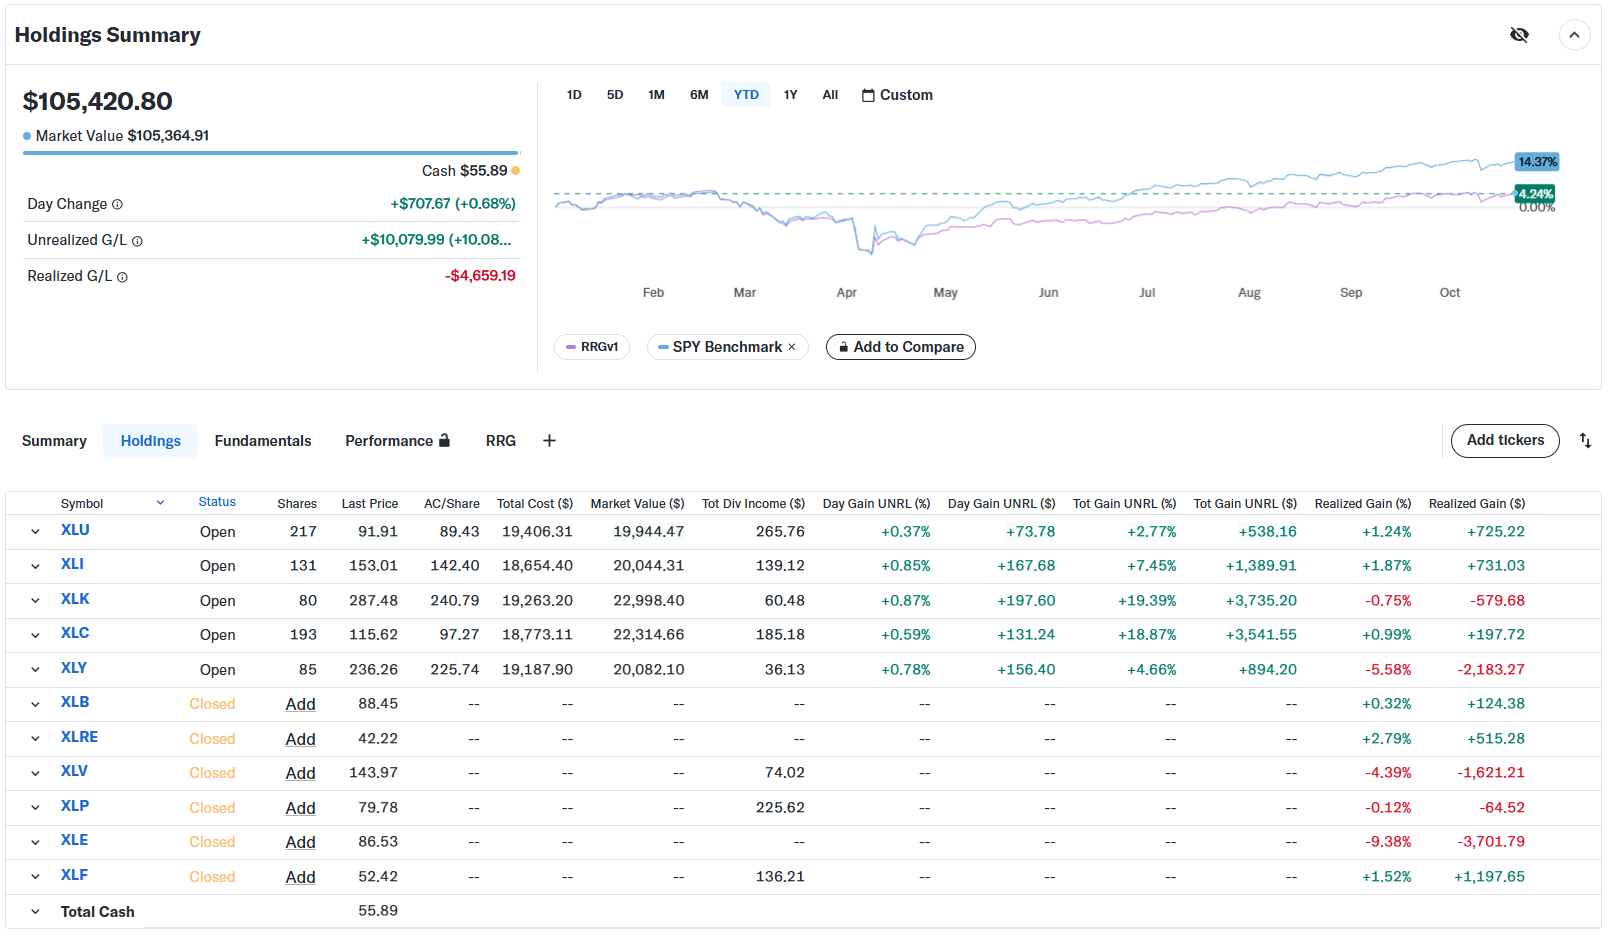
From a portfolio perspective, we're still lagging the S&P 500 by about 10%. There have been no changes to the composition over the last two weeks, but it's clear that our equal-weight approach is holding us back.
With technology comprising about 30% of the S&P 500, our 20% allocation means we're essentially 10% underweight in the strongest sector, not an ideal situation when tech is outperforming.
Looking Ahead: Refining the Strategy
Given the performance gap, I'm planning to embark on a project before year-end to reconcile all the positions we've mentioned in this series over the past year. Instead of using an equal-weight 20% for each position, I want to develop an algorithmic approach to justify sector weights based on market capitalization when they're in the portfolio.
This ties back to an article I wrote a while ago on StockCharts.com titled (Technical) Market Analysis and Portfolio Construction are Two Completely Different Animals in the Same Zoo.
Constructing a portfolio based on technical insights is a job in itself, and it's often overlooked. As part of this ongoing test of this rules-based approach, I want to put this aspect front and center and see how a different weighting scheme might impact our strategy.
Stay tuned for updates on this project. I'm as curious as you are to see the potential impact on our performance.
#StayAlert, --Julius


