The Best Five Sectors This Week, #42
Key Takeaways
- S&P 500 up almost 2% last week
- Technology sector maintains lead in rankings
- Weekly RRG shows stability in top sectors
- Real Estate and Energy swapping positions
Top 5 remains stable
The S&P 500 had a solid week, gaining nearly 2%, but this broad market strength didn't significantly shake up the sector rankings. Technology continues to lead the pack, followed by Utilities, Communication Services, Consumer Discretionary, and Industrials, rounding out the top five.
The only position change this week is coming at the bottom of the list, where Real Estate moved up to #9, pushing Energy down to #10.
- (1) Technology - (XLK)
- (2) Utilities - (XLU)
- (3) Communication Services - (XLC)
- (4) Consumer Discretionary - (XLY)
- (5) Industrials - (XLI)
- (6) Healthcare - (XLV)
- (7) Financials - (XLF)
- (8) Materials - (XLB)
- (10) Real-Estate - (XLRE)*
- (9) Energy - (XLE)*
- (11) Consumer Staples - (XLP)
Weekly RRG
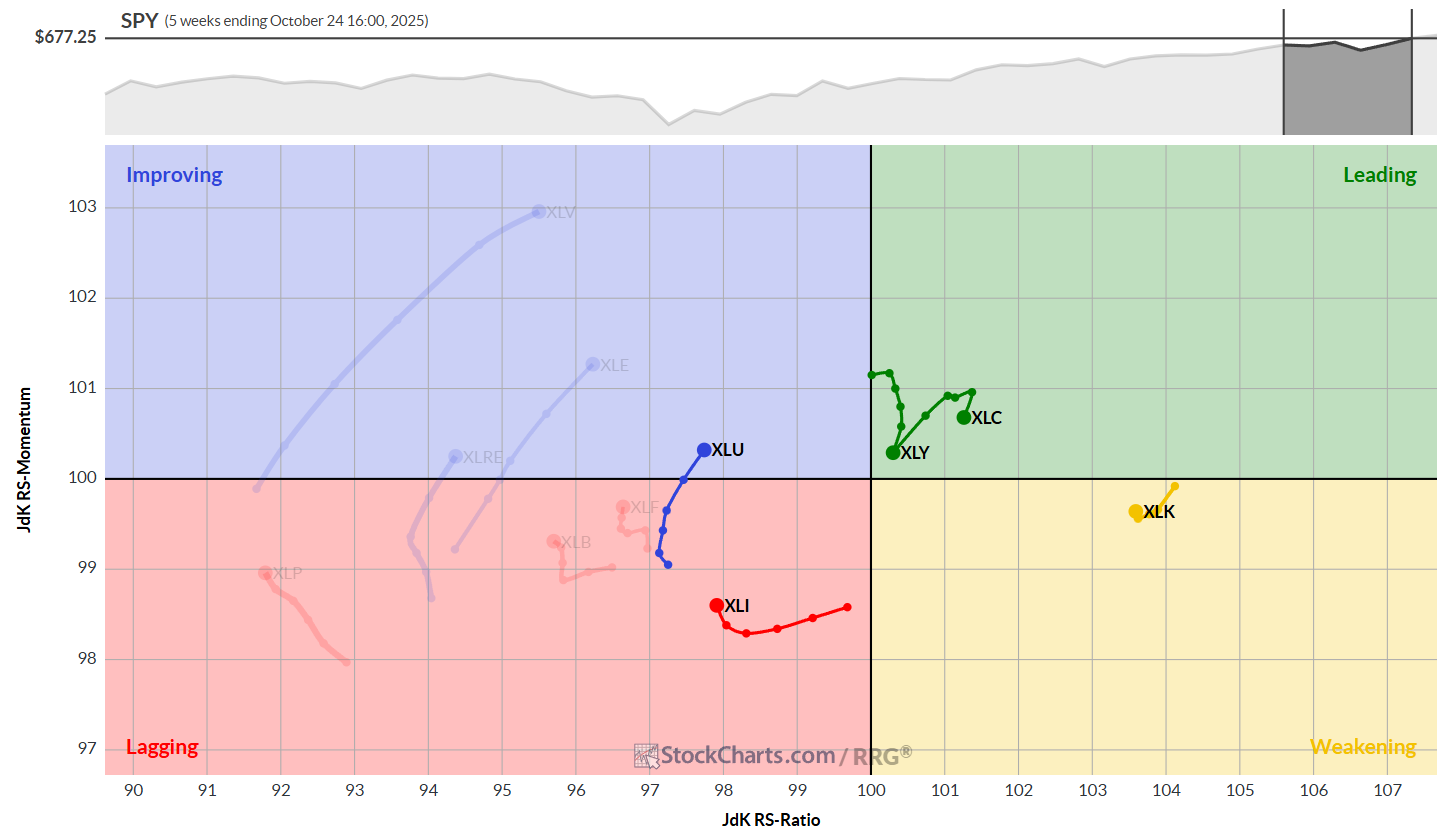
On the weekly RRG, we're seeing a largely stable picture for the top-performing sectors:
- Technology: Remains at the highest RS-Ratio reading, inside the weakening quadrant, but showing signs of turning up
- Communication Services: Hooked down inside the leading quadrant, still in a relative uptrend but losing some momentum
- Consumer Discretionary: In the leading quadrant but close to the benchmark, losing RS momentum for four weeks
- Utilities: Continuing to travel at a positive RRG-Heading inside the improving quadrant
- Industrials: In the lagging quadrant but slowly picking up relative momentum
The remaining sectors are further to the left on the RS ratio scale, without enough RS momentum to break into the top five, at least for now.
Daily RRG
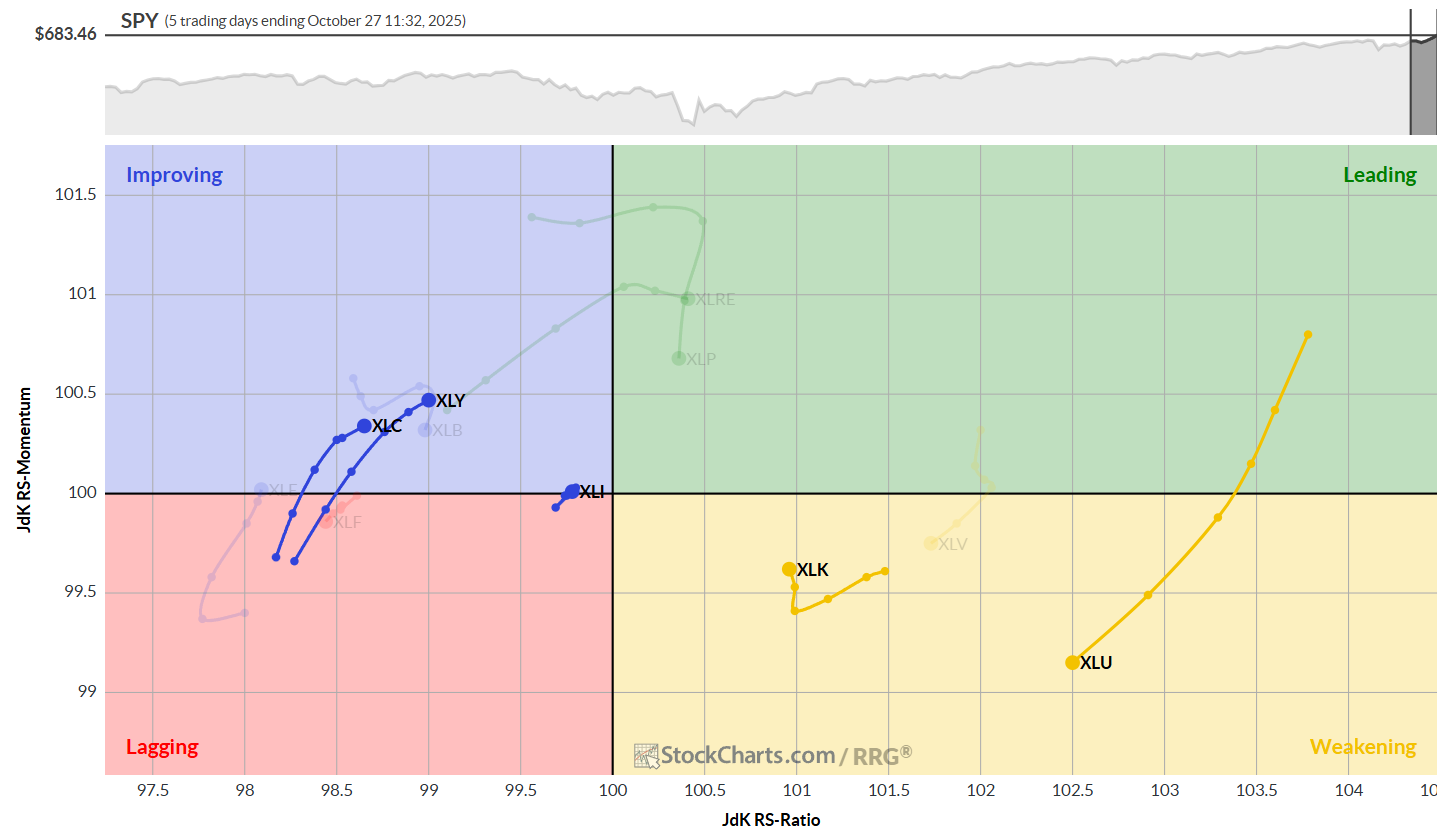
The daily RRG offers some interesting insights that could signal upcoming changes:
- Utilities: Long tail pushing into weakening quadrant, but high RS ratio keeps potential for turnaround open
- Technology: Inside weakening quadrant but moving back towards leading
- Industrials: Short tail close to benchmark, almost in line with the market
- Communication Services and Consumer Discretionary: Both are in the improving quadrant with positive RRG headings.
These daily movements might provide the momentum needed to turn around the weekly tails for Communication Services and Consumer Discretionary, which are currently rolling over in the weekly view.
Technology
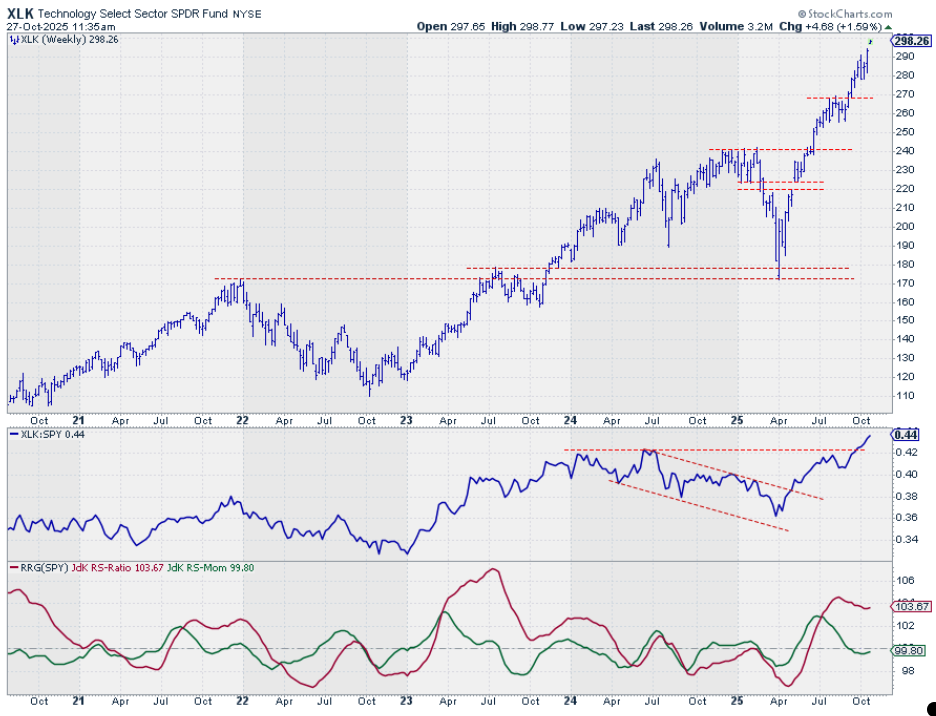
Tech continues its impressive rally, pushing to new all-time highs in both price and relative strength. This performance underscores the sector's current dominance, with no signs of slowing down here.
Utilities
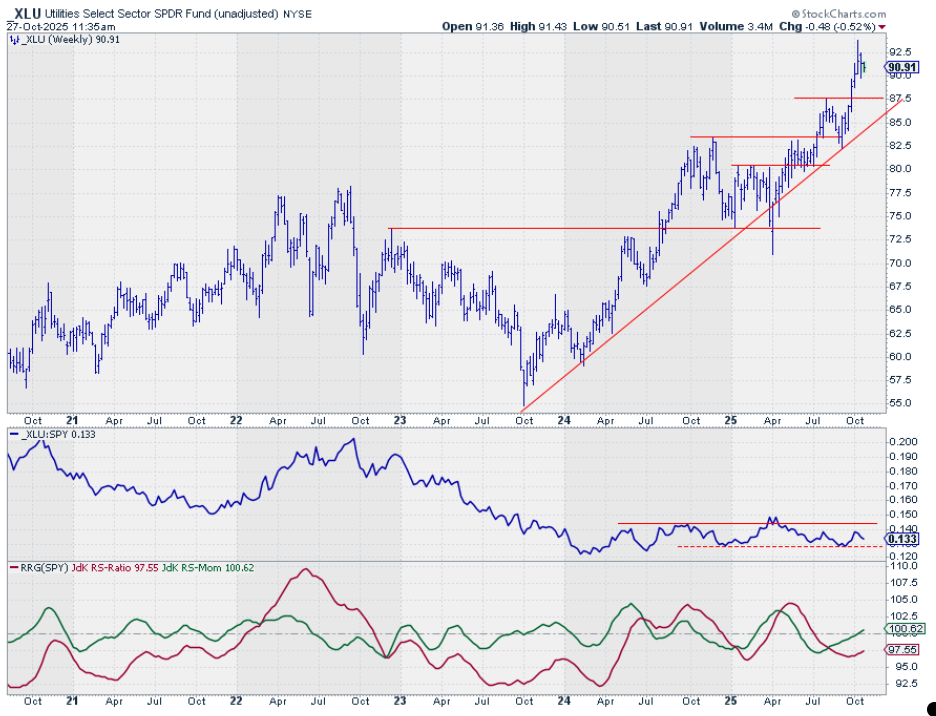
Utilities are showing stability with an inside bar last week. The RS line is moving upward within its sideways trading range, supported by rising RRG lines. Solid performance, if not spectacular.
Communication Services
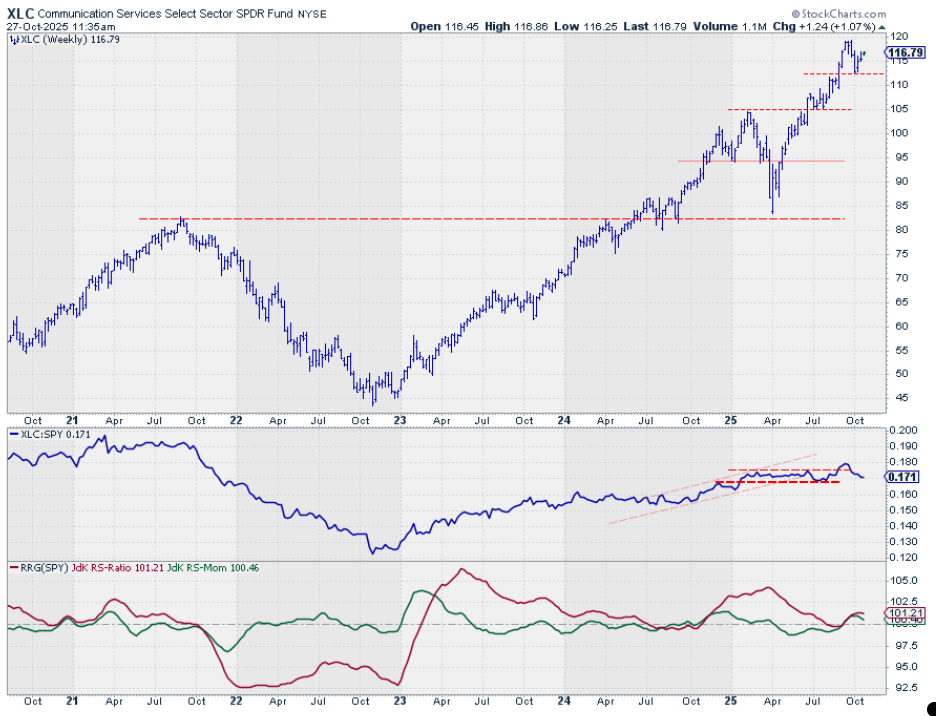
Communication Services has clearly made a higher low and is working its way up. However, the RS line needs to follow suit and set a new higher low; this lag is keeping the RRG lines under pressure.
Consumer Discretionary
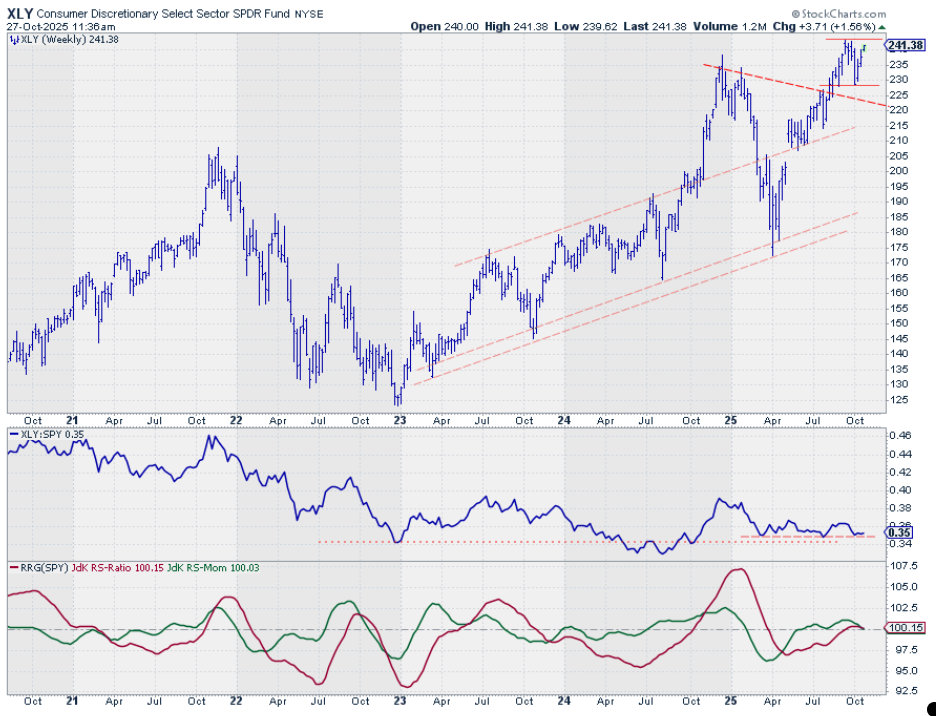
Consumer Discretionary is moving up after setting a higher low, now closing in on its all-time high above the $240 mark.
In relative terms, it's testing support; maintaining this level is crucial for the sector's underlying strength. The RRG lines are rolling over, reflecting the RS line's inability to push higher. This needs to change soon to maintain the positive outlook.
Industrials
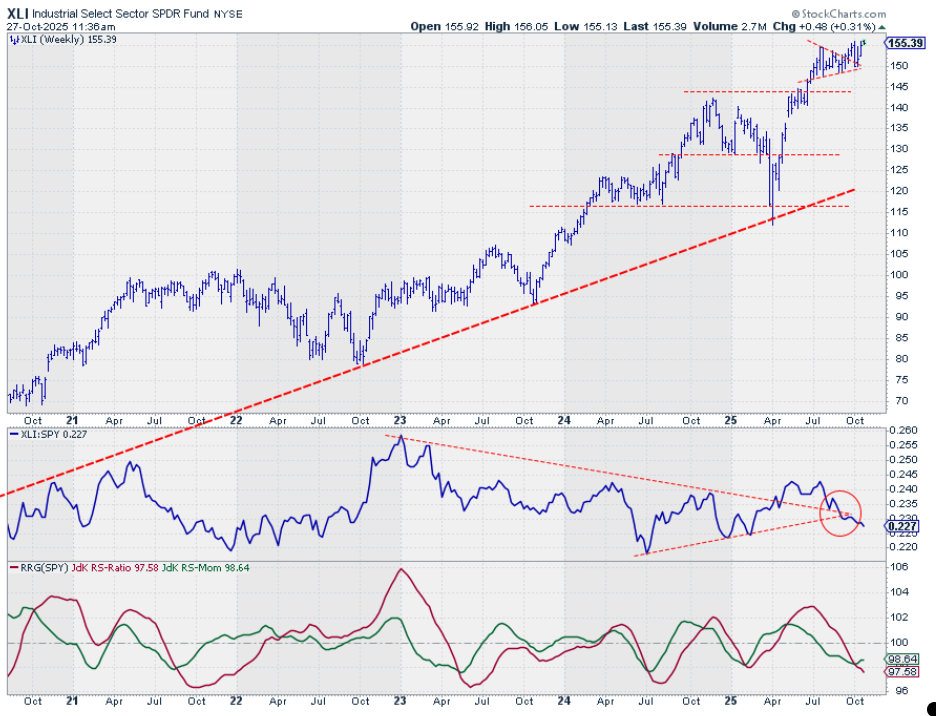
Industrials present a mixed picture; the price chart looks okay (not strong, but not negative), while the RS line shows continued weakness.
This is pushing the RRG lines lower, putting Industrials at risk of dropping out of the top five.
Portfolio Performance
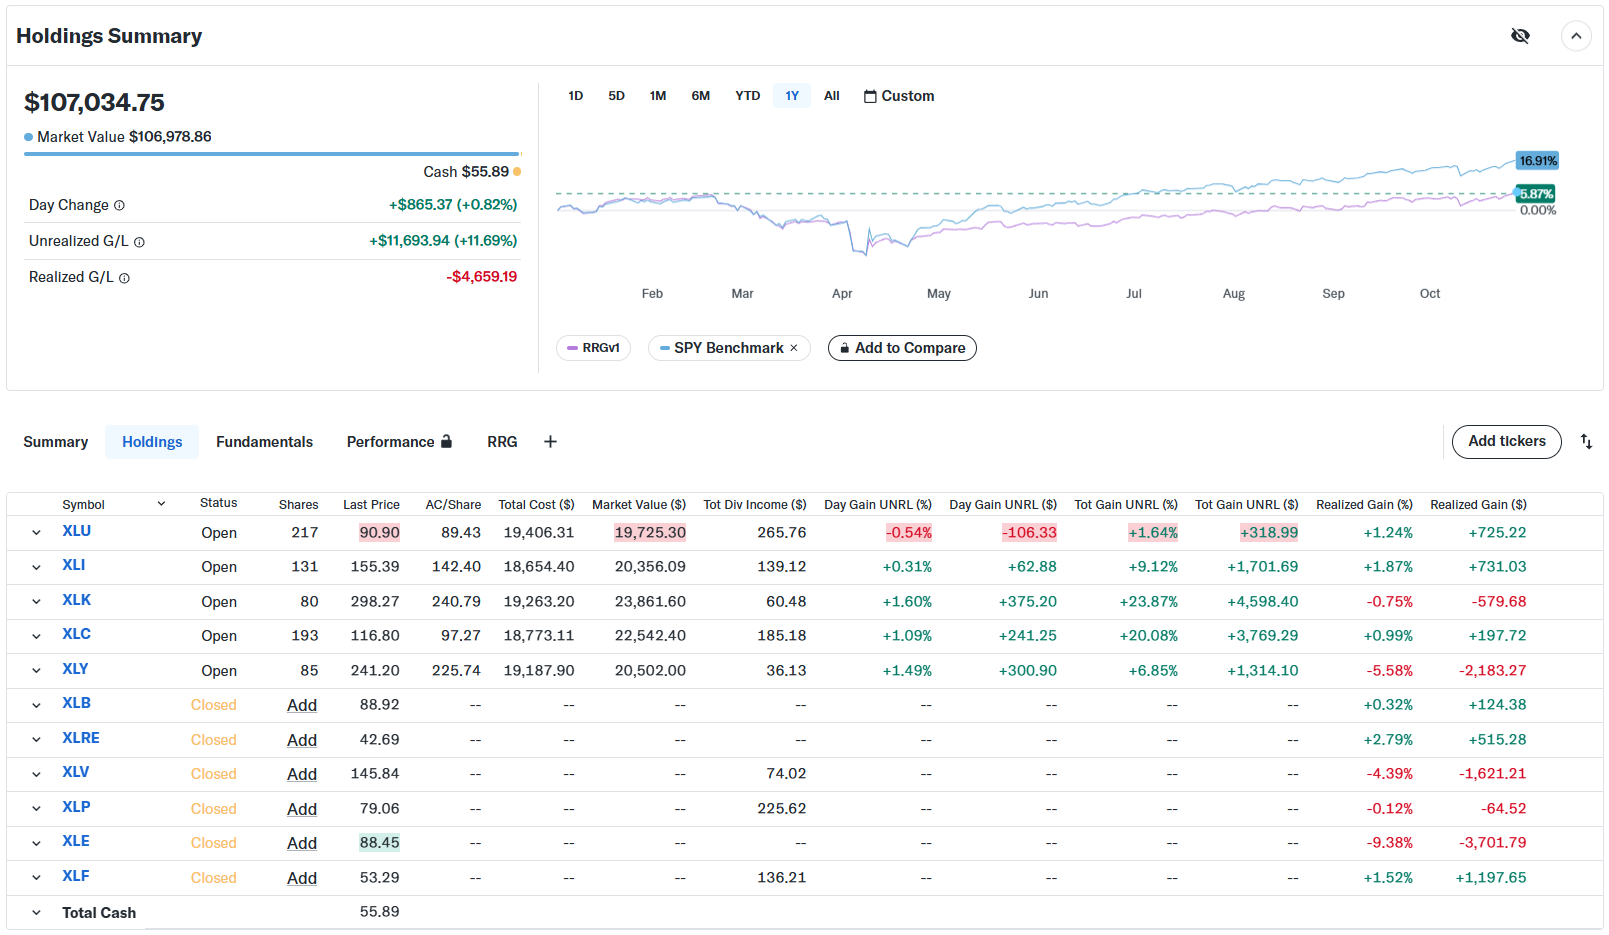
Despite showing a positive return year-to-date, our portfolio is now trailing the S&P 500 by 10–11%.
The gap continues to widen, primarily due to the strategy's underweight position in the surging Technology sector. Even with Tech in the top five, our allocation (equal weight 20%) isn't enough to keep pace with the benchmark in this Tech-driven market.
#StayAlert and have a great weekend. --Julius


