The Best Five Sectors This Week #54
Key Takeaways
- Leadership remains unchanged at the top.
- Energy and Materials continue to show structural relative strength, with confirmed breakouts and RRG readings well above 100.
- Defensive sectors like Utilities and Real Estate are improving, while Technology, Communication Services, Financials, and Consumer Discretionary remain in or near lagging.
- Health Care is pressing against major resistance near 160; a breakout would materially strengthen its relative outlook.
No Changes in Top Five
At the end of last week, on Friday, the composition of the top five remained unchanged. Energy remains the leading sector.
In the lower half, Utilities has risen further to #6, pushing Communication Services down to #8. Meanwhile, Financials and Consumer Discretionary are swapping positions at the bottom of the list.
- (1) Energy - XLE [11%]
- (2) Materials - XLB [7%]
- (3) Industrials - XLI [30%]
- (4) Consumer Staples - XLP [19%]
- (5) Health Care - XLV [33%]
- (8) Utilities - XLU*
- (7) Real Estate - XLRE
- (6) Communication Services - XLC*
- (9) Technology - XLK
- (11) Financials - XLF*
- (10) Consumer Discretionary - XLY*
The Weekly RRG
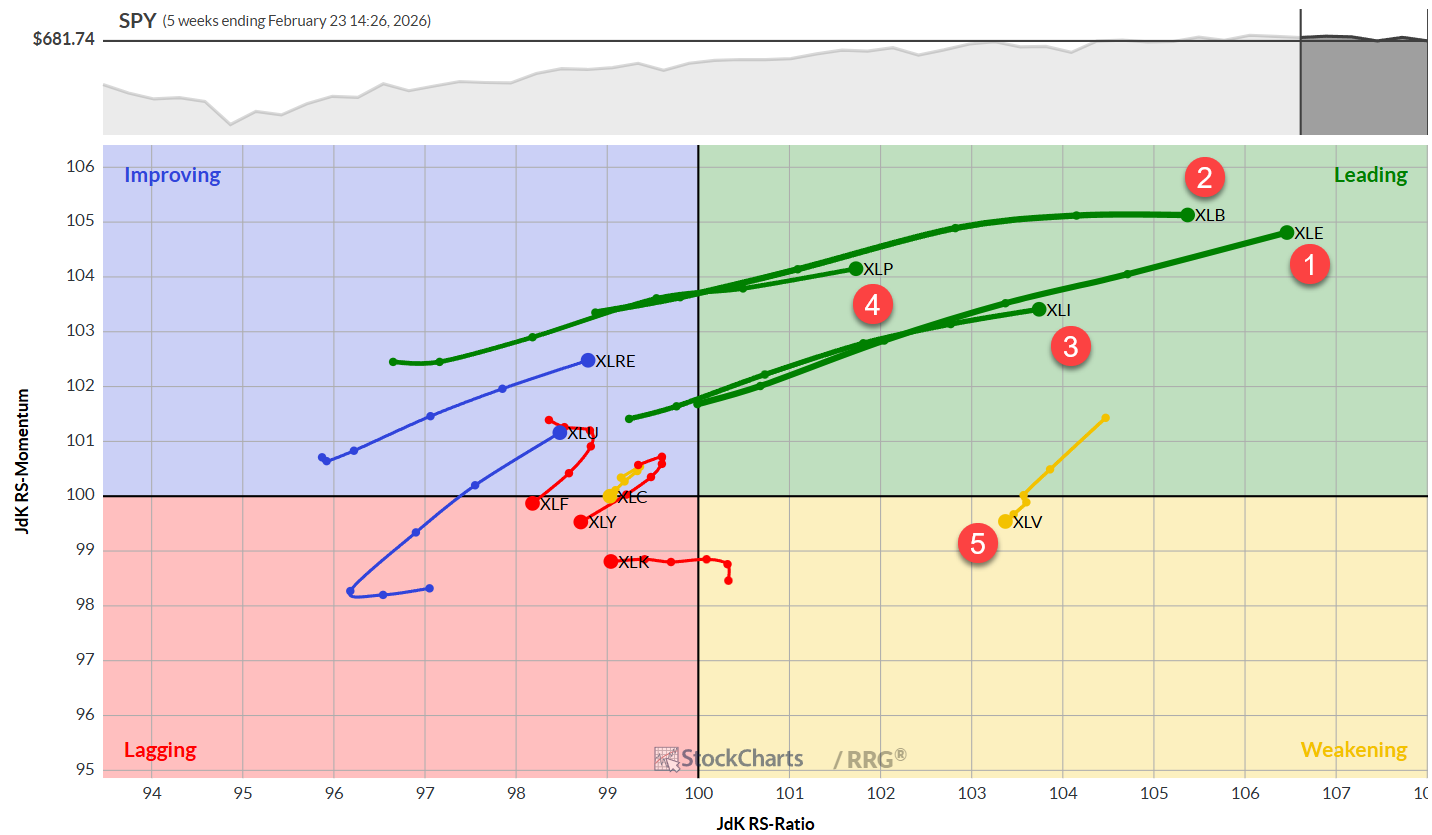
- The leading quadrant continues to be dominated by long tails for Energy, Materials, Industrials, and Consumer Staples.
- The Health Care sector has weakened and is still moving in a negative direction, but remains on a relatively high RS ratio, which keeps it inside the top five.
- Utilities and Real Estate have shown significant strength over the last couple of weeks.
- Financials, Communication Services, Consumer Discretionary, and Technology are all moving at a negative heading and are in or near the lagging quadrant.
The Daily RRG
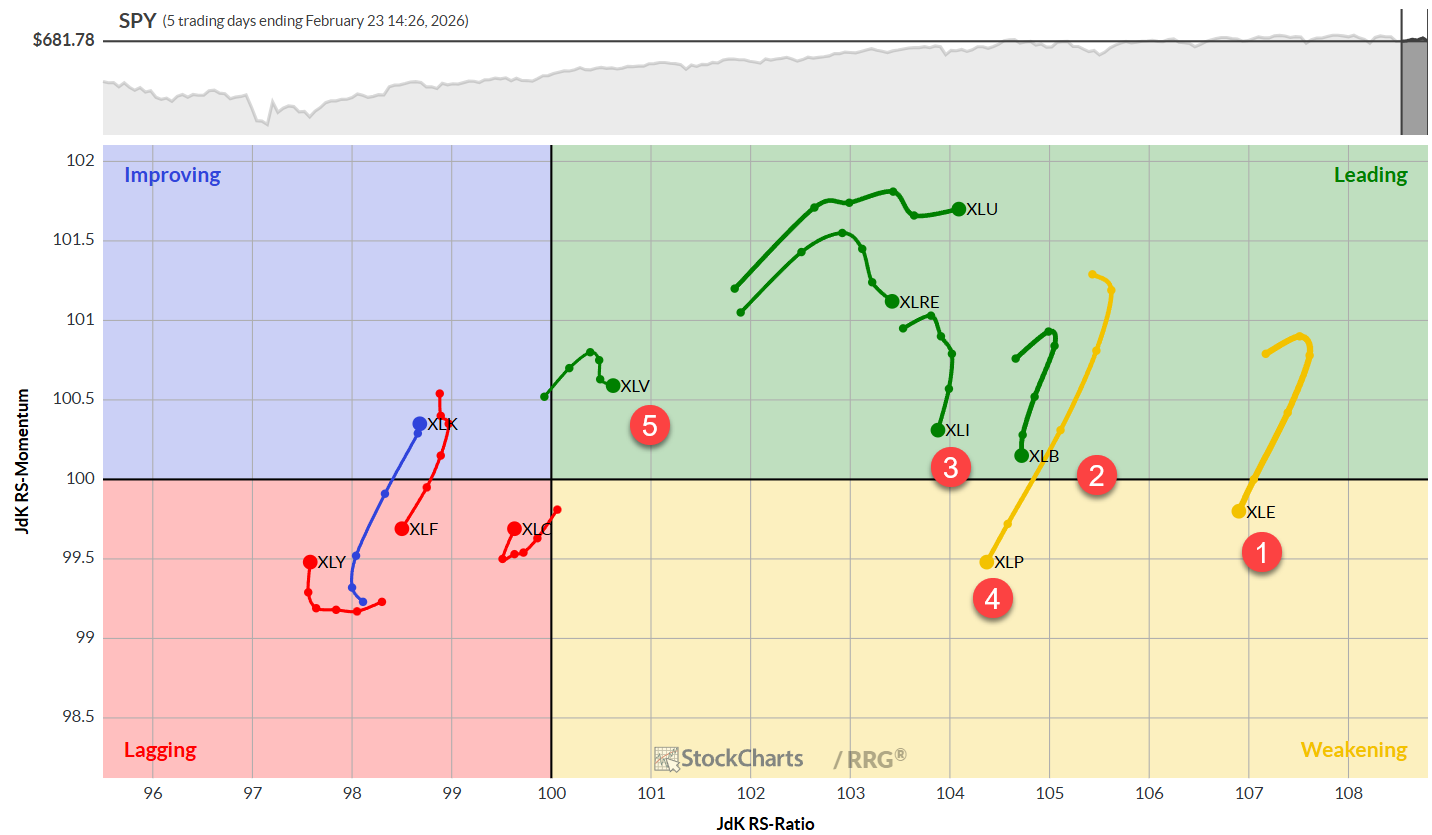
- The top five sectors are all on the right-hand side of the graph, confirming their general strength.
- Energy and Consumer Staples, numbers one and four, have dropped into the weakening quadrant and are undergoing a corrective move. Materials and Industrials appear to be following that rotation; they are still inside the leading quadrant but are heading towards weakening.
- Health Care has returned to the leading quadrant and is now gaining on the RS ratio scale again.
Sector Highlights
Energy
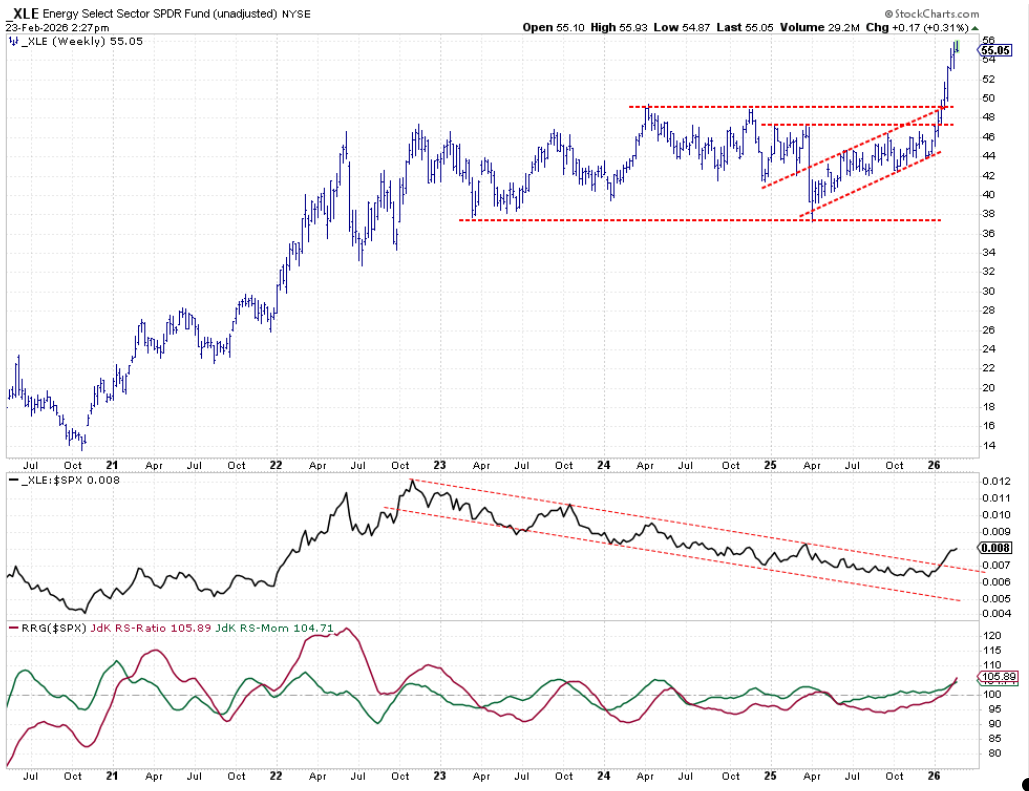
This sector continues to perform very well after the breakout and is pushing to new all-time highs. The break from the falling trend channel on the relative strength line remains intact, and both RRG lines are now accelerating higher above the one-hundred level.
Materials
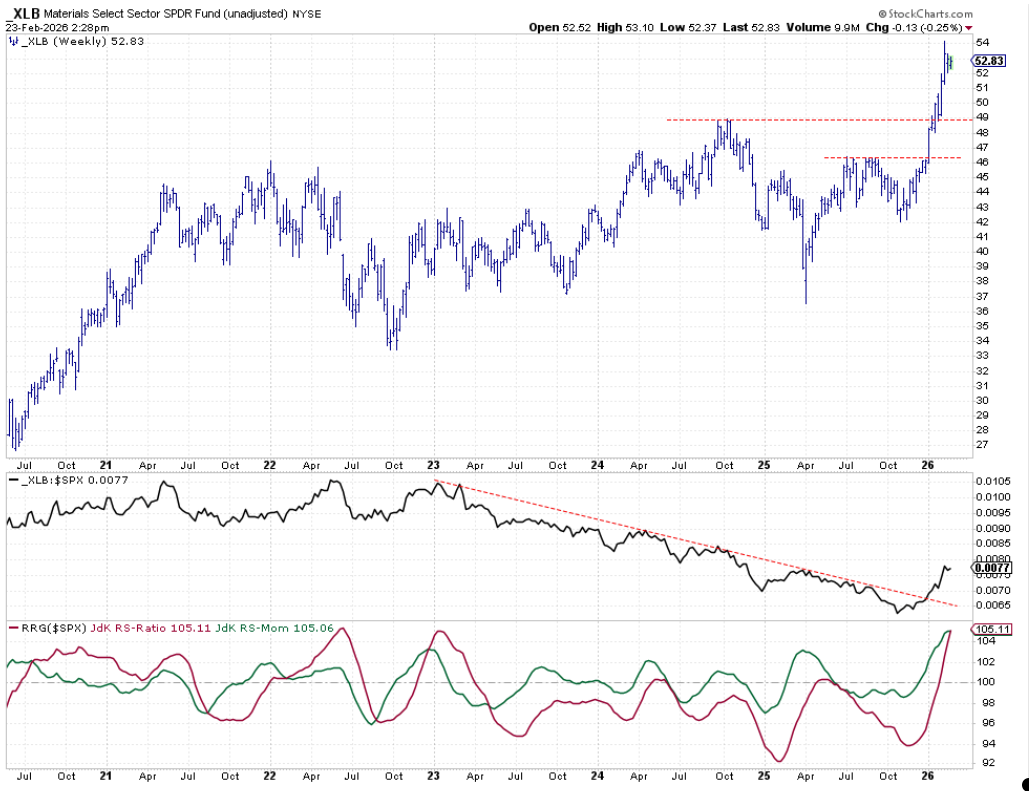
The Materials sector also continues to perform well. The last week and a half have been quiet but stable, around 52.50 for the materials sector. The break from the declining relative strength trend is holding up well, pushing both RRG lines to high levels, similar to what was seen in 2022 and 2023.
Industrials
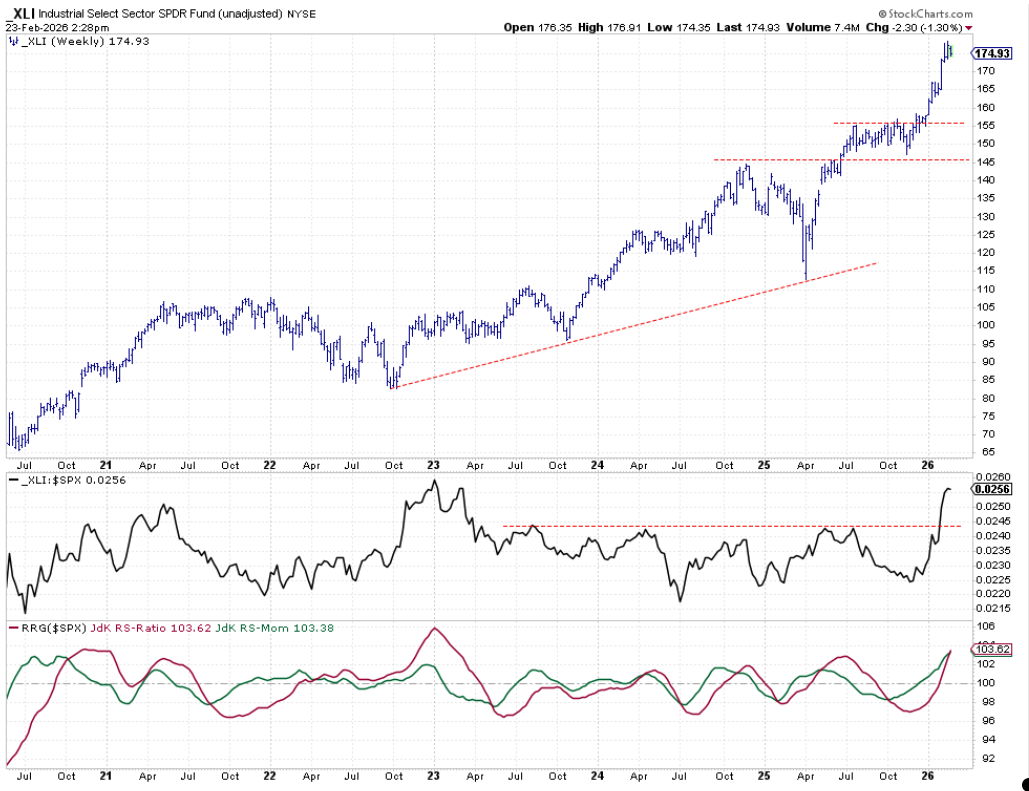
The Industrials sector is still at very high levels, holding around 175. The raw RS line is approaching the relative peak seen at the start of 2023. This may cause some resistance, but it is not a concern yet. Both RRG lines are well above one hundred and continuing higher.
Consumer Staples
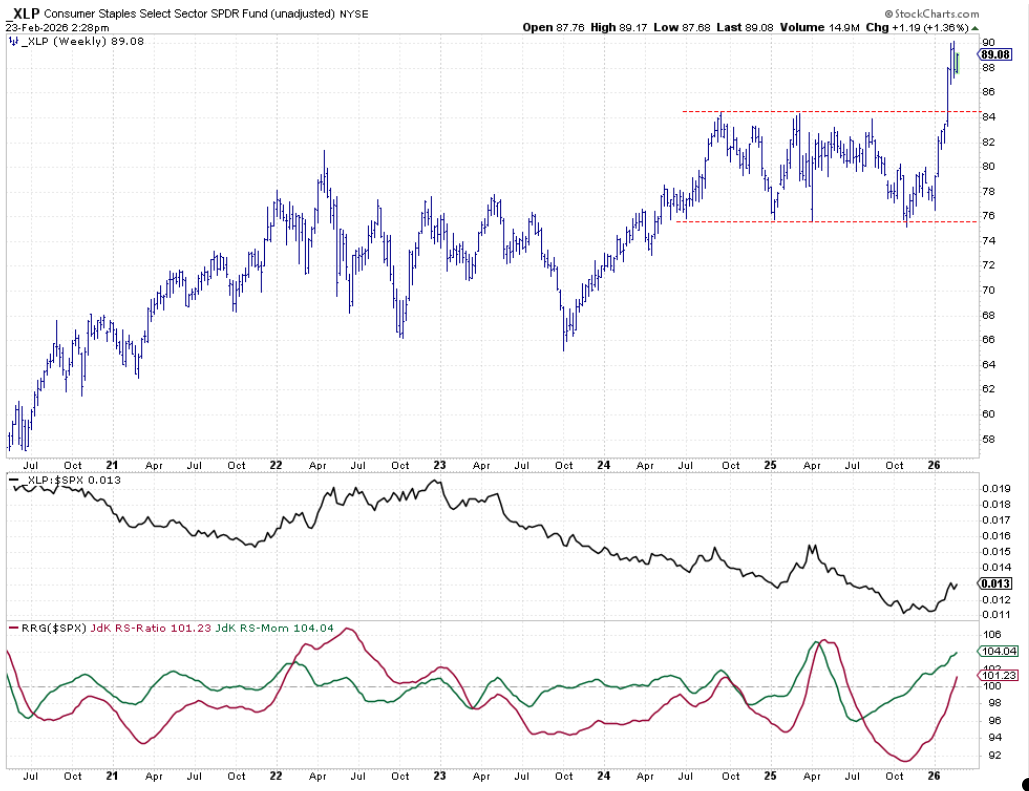
Consumer Staples is holding up well, around $88 to $89 dollars over the last two to three weeks, without dropping. There is room for a corrective move towards 84, where the first support level is found. Consumer Staples still need to convincingly break from the relative downtrend that started in 2023, but the RRG lines are comfortably above 100 and rising, putting the XLP tail well inside the leading quadrant at a positive heading.
Health Care
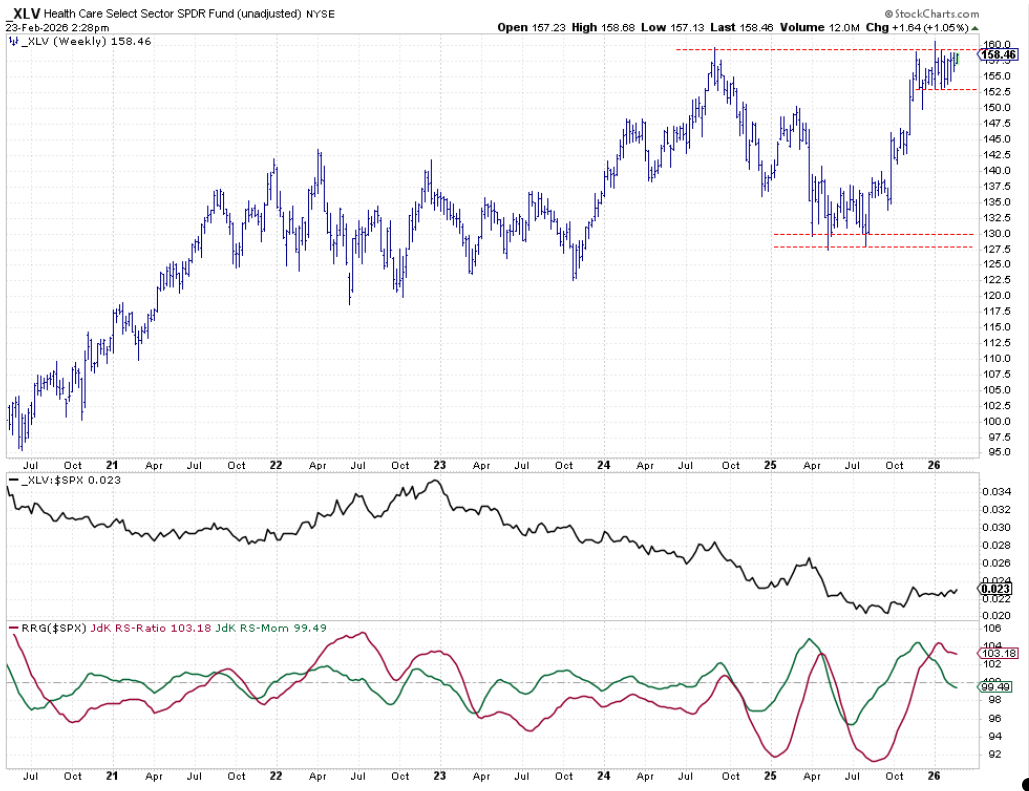
The Health Care sector continues to push against overhead resistance, just below 160. Last week, there was another attempt to break higher, which failed, and significant resistance is building in this area. If it breaks, we will likely see an aggressive rally higher. The key is to break above 160.
The relative strength line is still in its downtrend from the end of 2022 but has recently started moving sideways, with a new higher low beginning to form. If the raw relative strength line surpasses its previous high, it would help the relative performance of the healthcare sector.
The RRG lines are signaling a correction within the already established relative uptrend. The red RS ratio line is above one hundred, and the green RS momentum line just dipped below one hundred. Once the green line turns back above 100, that would be a strong signal for the healthcare sector.
Performance
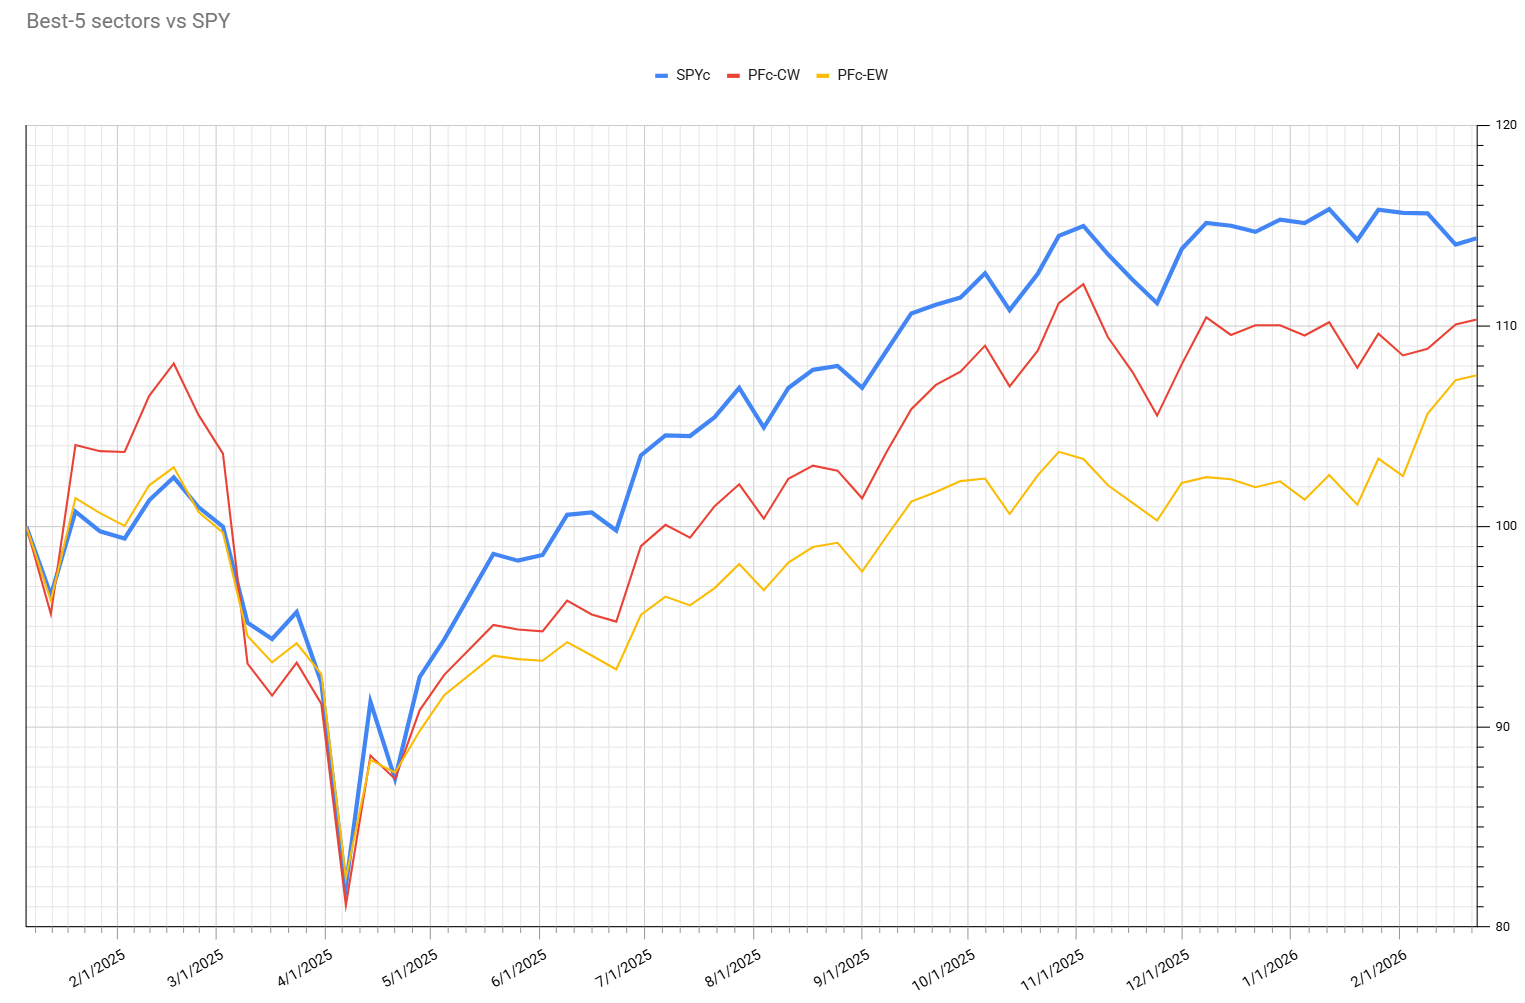
On the performance graph, both portfolios — cap-weighted and the equal-weighted — are continuing to recoup their underperformance relative to the S&P 500. On Monday, the CW portfolio was 3.8% behind SPY, and the EW portfolio 6.7% The equal-weighted version is performing very well, and the cap-weighted version is now also starting to pick up again.
#StayAlert, Julius