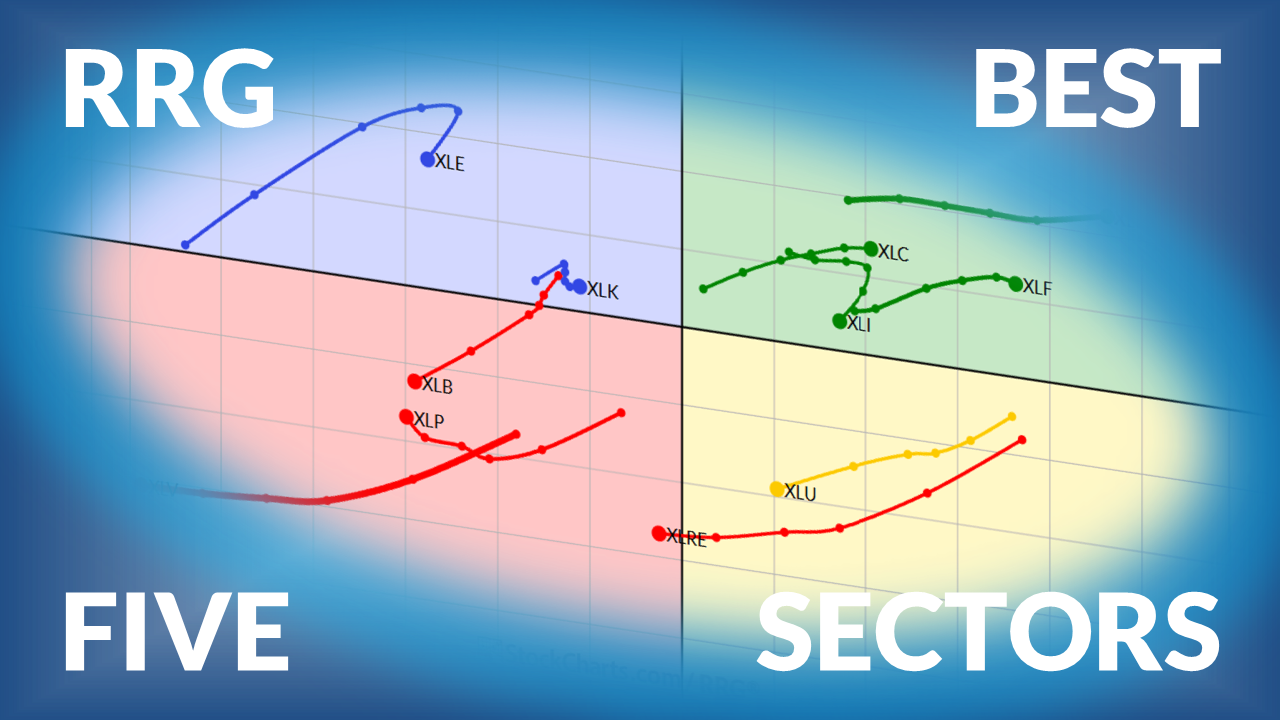
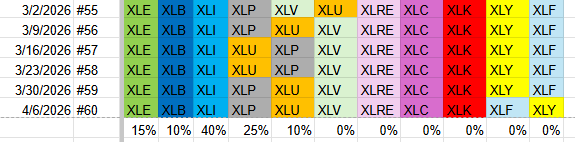
The Best Five Sectors This Week #60
Key Takeaways
- Energy leads the sector rankings but shows signs of slowing momentum on the RRG.
- Defensive sectors (Staples, Utilities) maintain strength with positive RRG trajectories.
- Industrials and Consumer Staples show resilience, rebounding from key support levels.
- Defensive portfolios tend to underperform during strong S&P 500 weeks but remain well-positioned for market weakness.
After a week in which the S&P 500 gained around three percent, the sector rankings remained largely unchanged.
The top five sectors held their positions. At the bottom of the list, though, we see a minor shift: Financials moved up from 11th to 10th place, pushing Consumer Discretionary down to 11th.
Here’s how the current sector ranking stands:
- (1) Energy - XLE [15%]
- (2) Materials - XLB [10%]
- (3) Industrials - XLI [40%]
- (4) Consumer Staples - XLP [25%]
- (5) Utilities - XLU [10%]
- (6) Health Care - XLV
- (7) Real Estate - XLRE
- (8) Communication Services - XLC
- (9) Technology - XLK
- (11) Financials - XLF*
- (10) Consumer Discretionary - XLY*
Weekly RRG
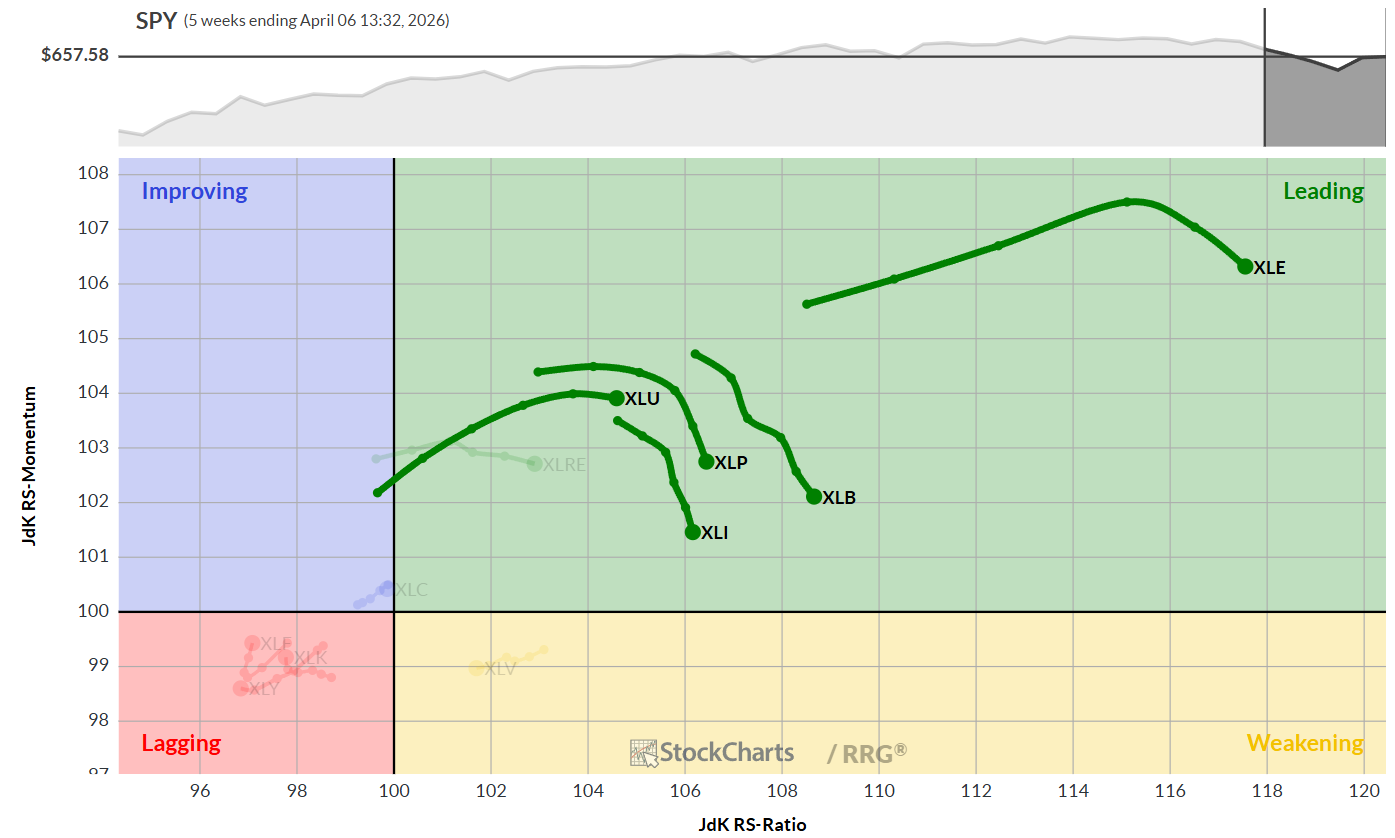
Looking at the weekly Relative Rotation Graph (RRG), all five leading sectors remain firmly in the leading quadrant. They continue to move higher on the RS-ratio scale, indicating that their relative uptrends are intact, though there is a slight loss of relative momentum. This suggests that while these sectors are still outperforming, the pace of their outperformance is slowing.
Daily RRG
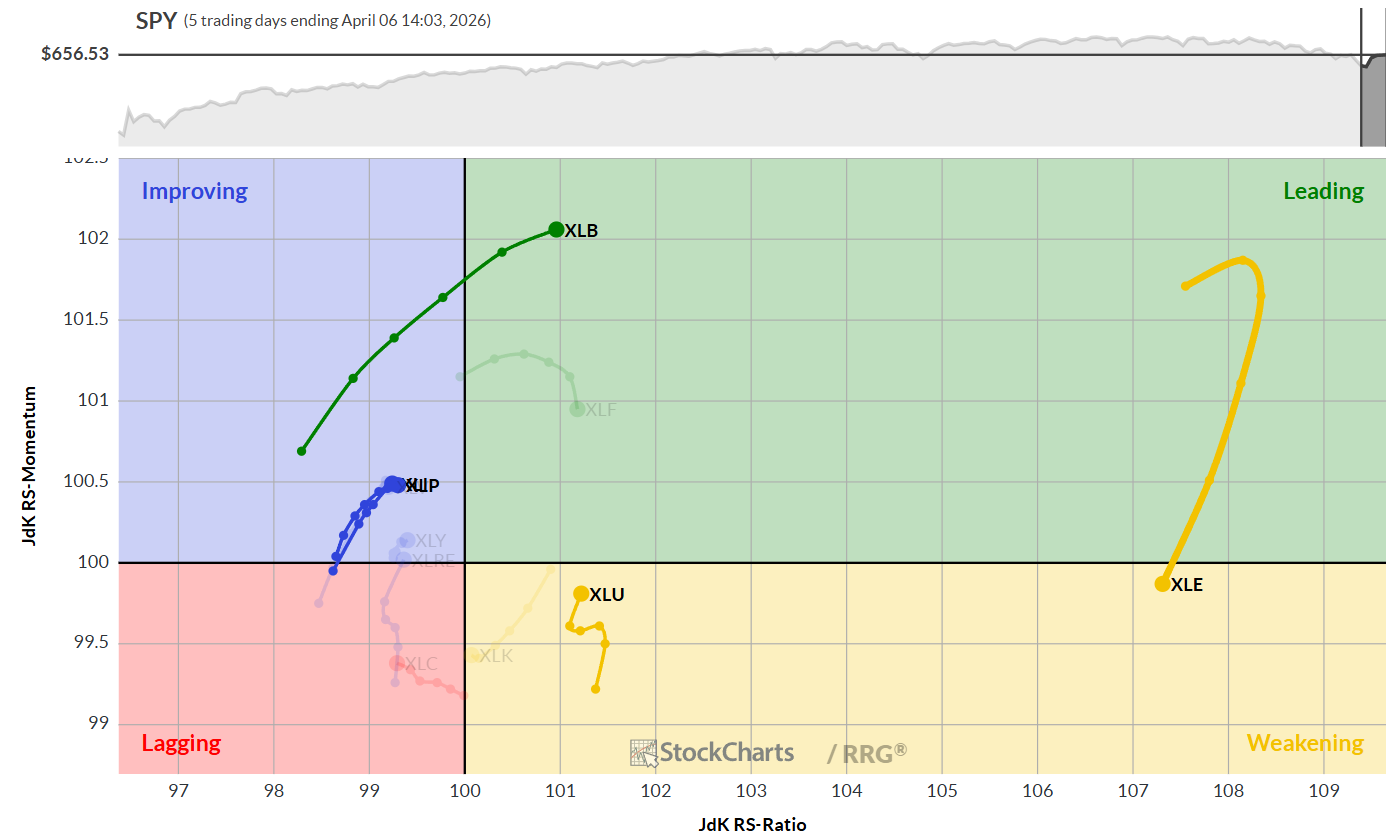
The daily RRG chart provides a more detailed view. Energy, the strongest sector, shows the highest RS-ratio reading, but is beginning to roll over into the weakening quadrant, signaling a pause in its uptrend.
More importantly, the other four sectors in the top five—Materials, Industrials, Consumer Staples, and Utilities—are all on a positive RRG heading. This means they are gaining on both the RS-ratio and RS-momentum scales, a positive sign for their continued strength.
Materials is moving back into the leading quadrant, confirming its strong weekly position. Utilities is rotating from weakening back toward leading, indicating a new upward leg in its established uptrend. Industrials and Staples are following similar trajectories, both in the improving quadrant and nearing re-entry into the leading quadrant, supporting their weekly uptrends.
Sector Highlights
Energy
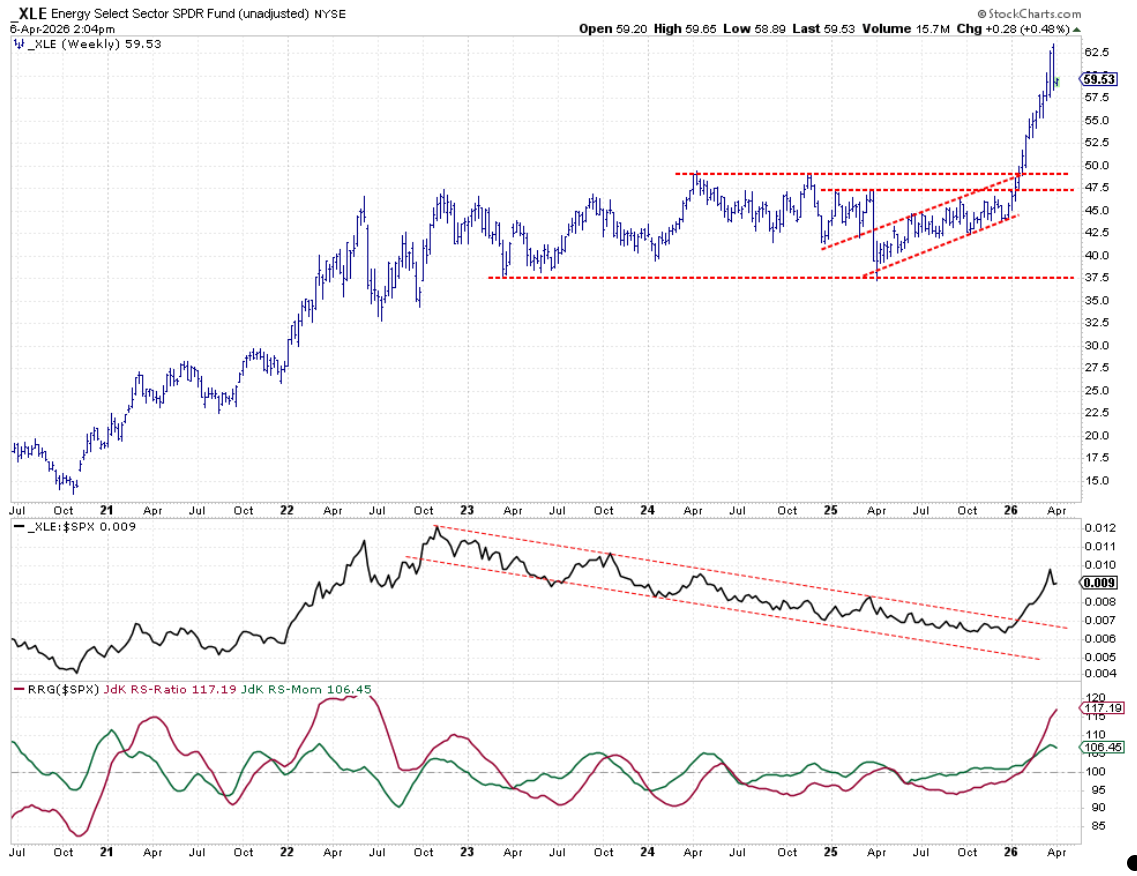
The energy sector continues to perform well, with each week’s highs and lows exceeding those of the previous week; the chart maintains a positive price outlook. The relative strength (RS) line confirms a valid breakout, though a slight dip reflects the recent pause in the RRG. Overall, the RRG lines remain well above 100, indicating a strong positive trend.
Materials
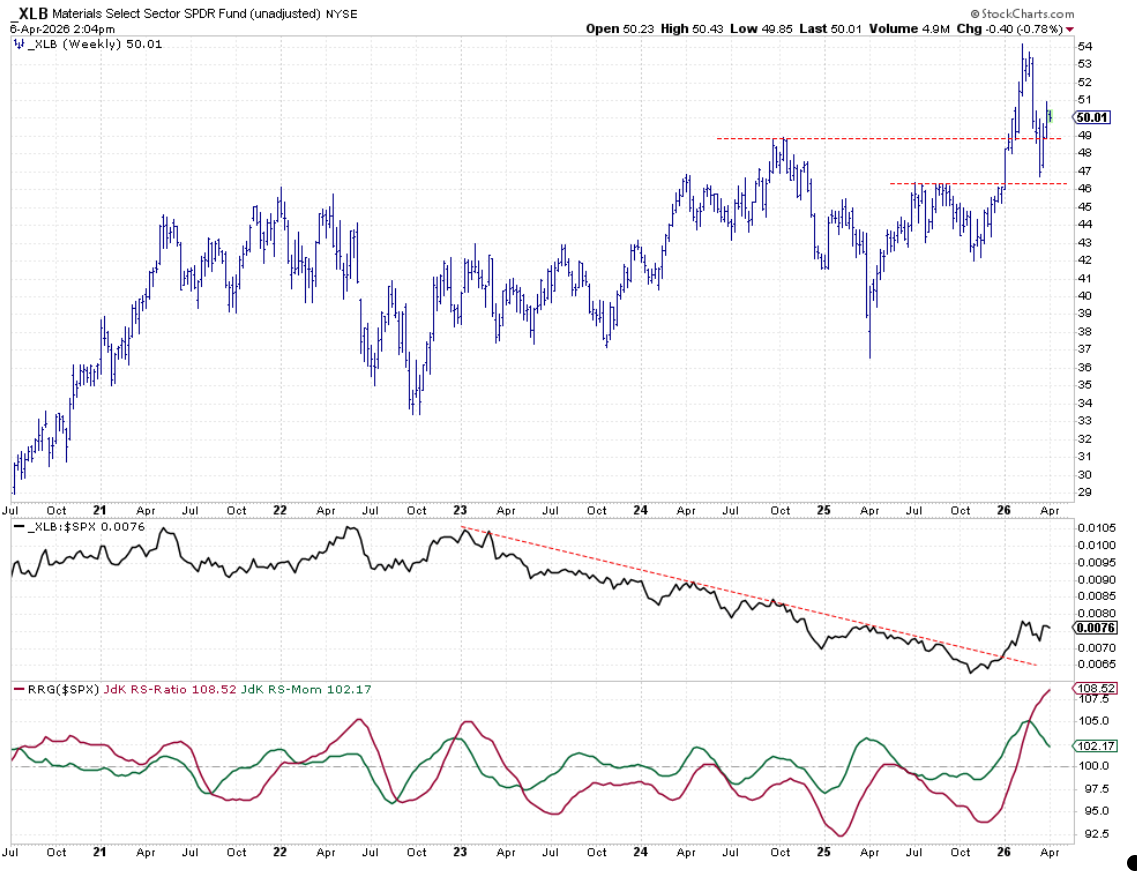
Materials rebounded strongly after a dip from 54 down to nearly 46, finding support and climbing back above the breakout level, currently stabilizing around 50. This suggests a new upward leg in its series of higher highs and lows. While the RS-momentum is slowing, the RS-ratio remains high, providing enough cushion for a corrective move without breaking the uptrend.
Industrials
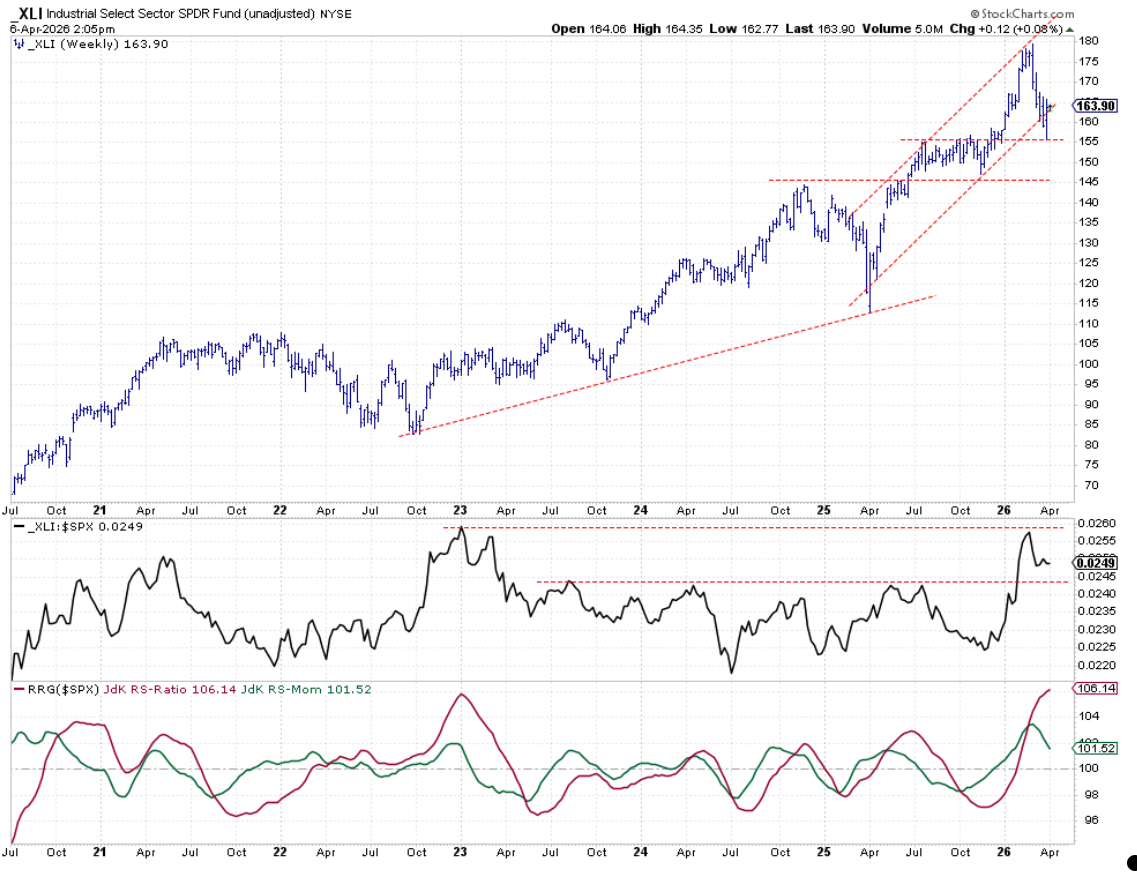
Industrials found support at prior resistance around $155 and appear to be resuming their uptrend within the boundaries of the channel, continuing the pattern of higher highs and higher lows. The RS line has peaked against resistance dating back to early 2023, but the RS-ratio remains high, suggesting that any current correction is likely temporary.
Consumer Staples
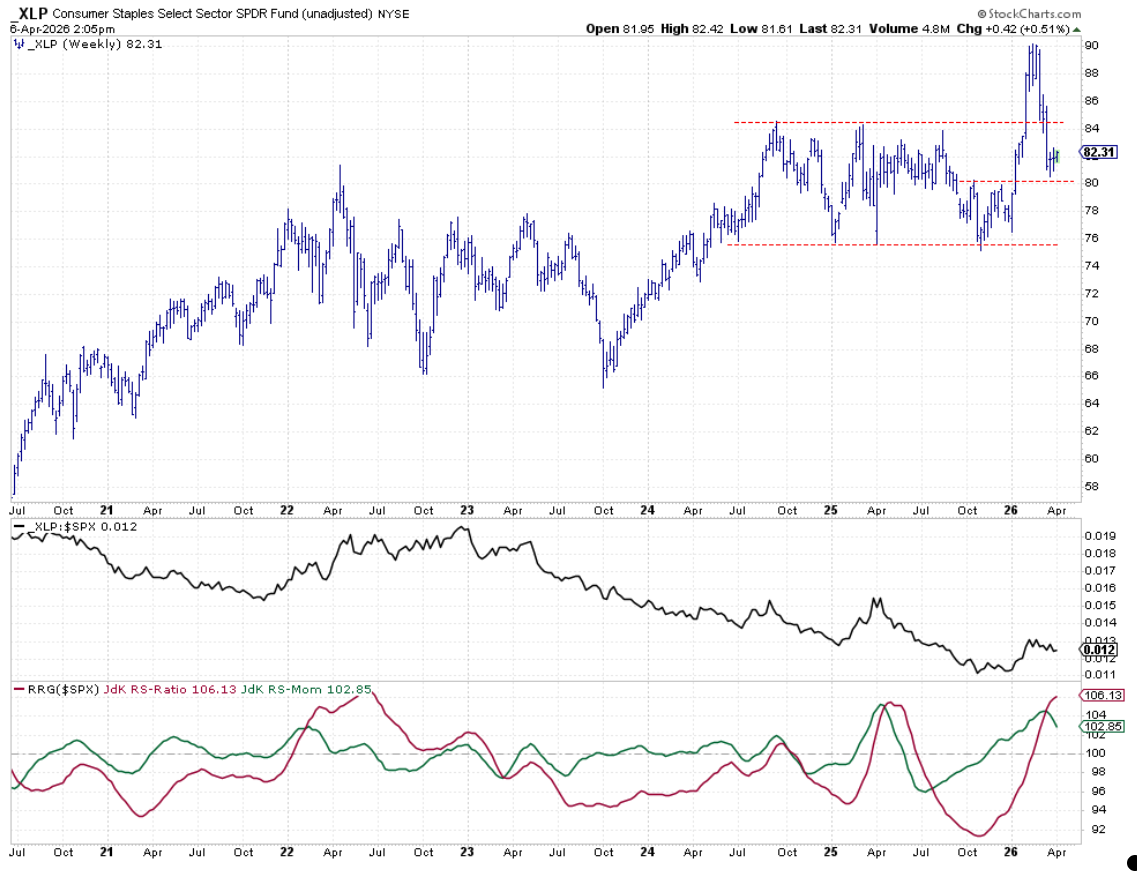
Consumer staples dropped sharply from around 90 to support near 80, establishing a solid low just above that support level. As long as this support holds, the sector’s outlook remains positive. The RS line is struggling to move higher, but the RS-ratio is well above 100. A breakout above the recent RS high would likely reignite momentum and push the sector further into the leading quadrant.
Utilities
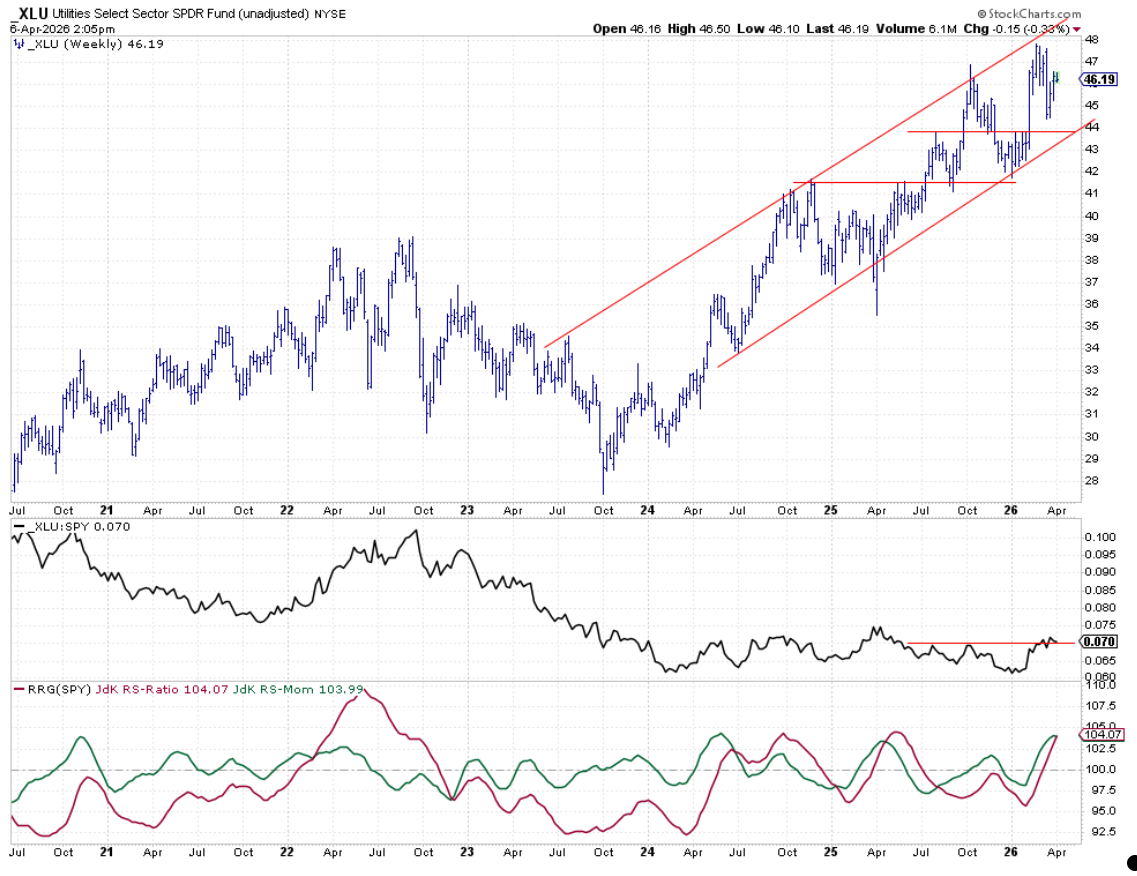
Utilities, often seen as slow and steady, continue to set higher highs and lows within a rising channel.
The RS line is testing horizontal resistance but hasn’t broken through convincingly yet. Both RRG lines are above 100 and, while momentum is slowing, there is enough strength for a potential new upward leg in the established uptrend.
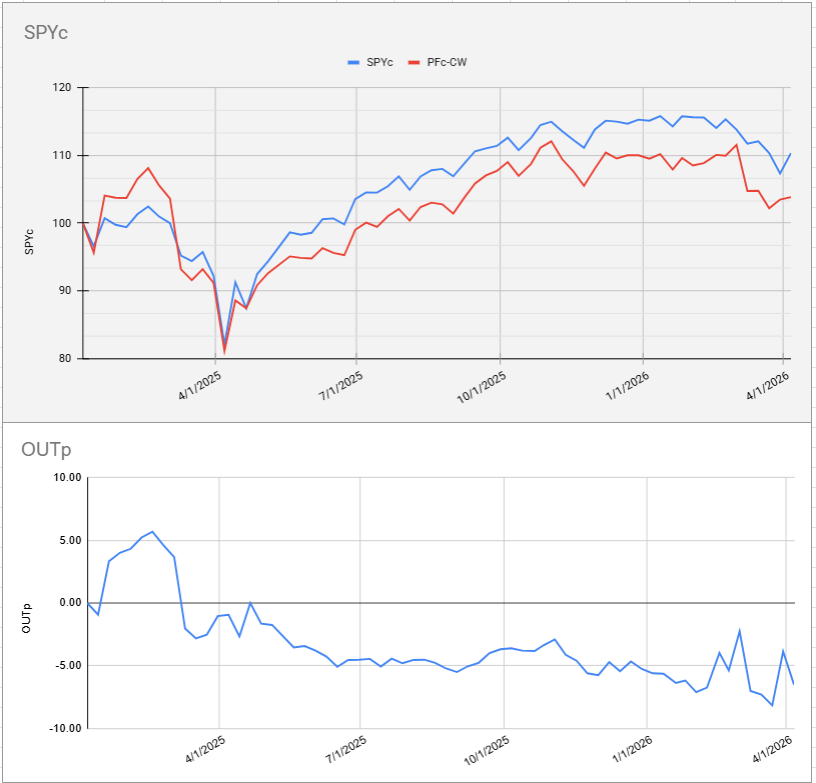
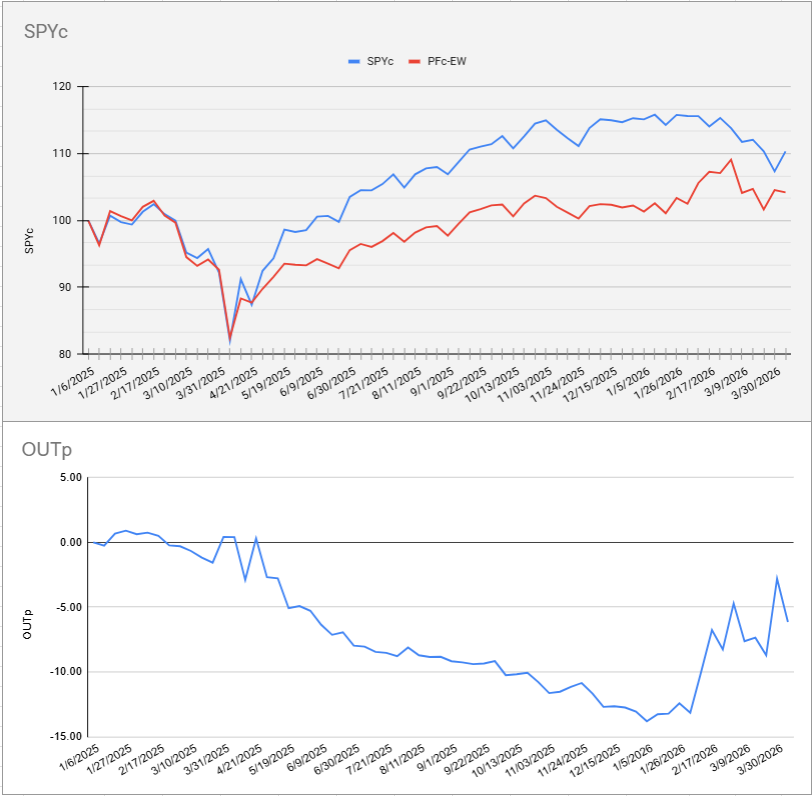
Portfolio Perspective
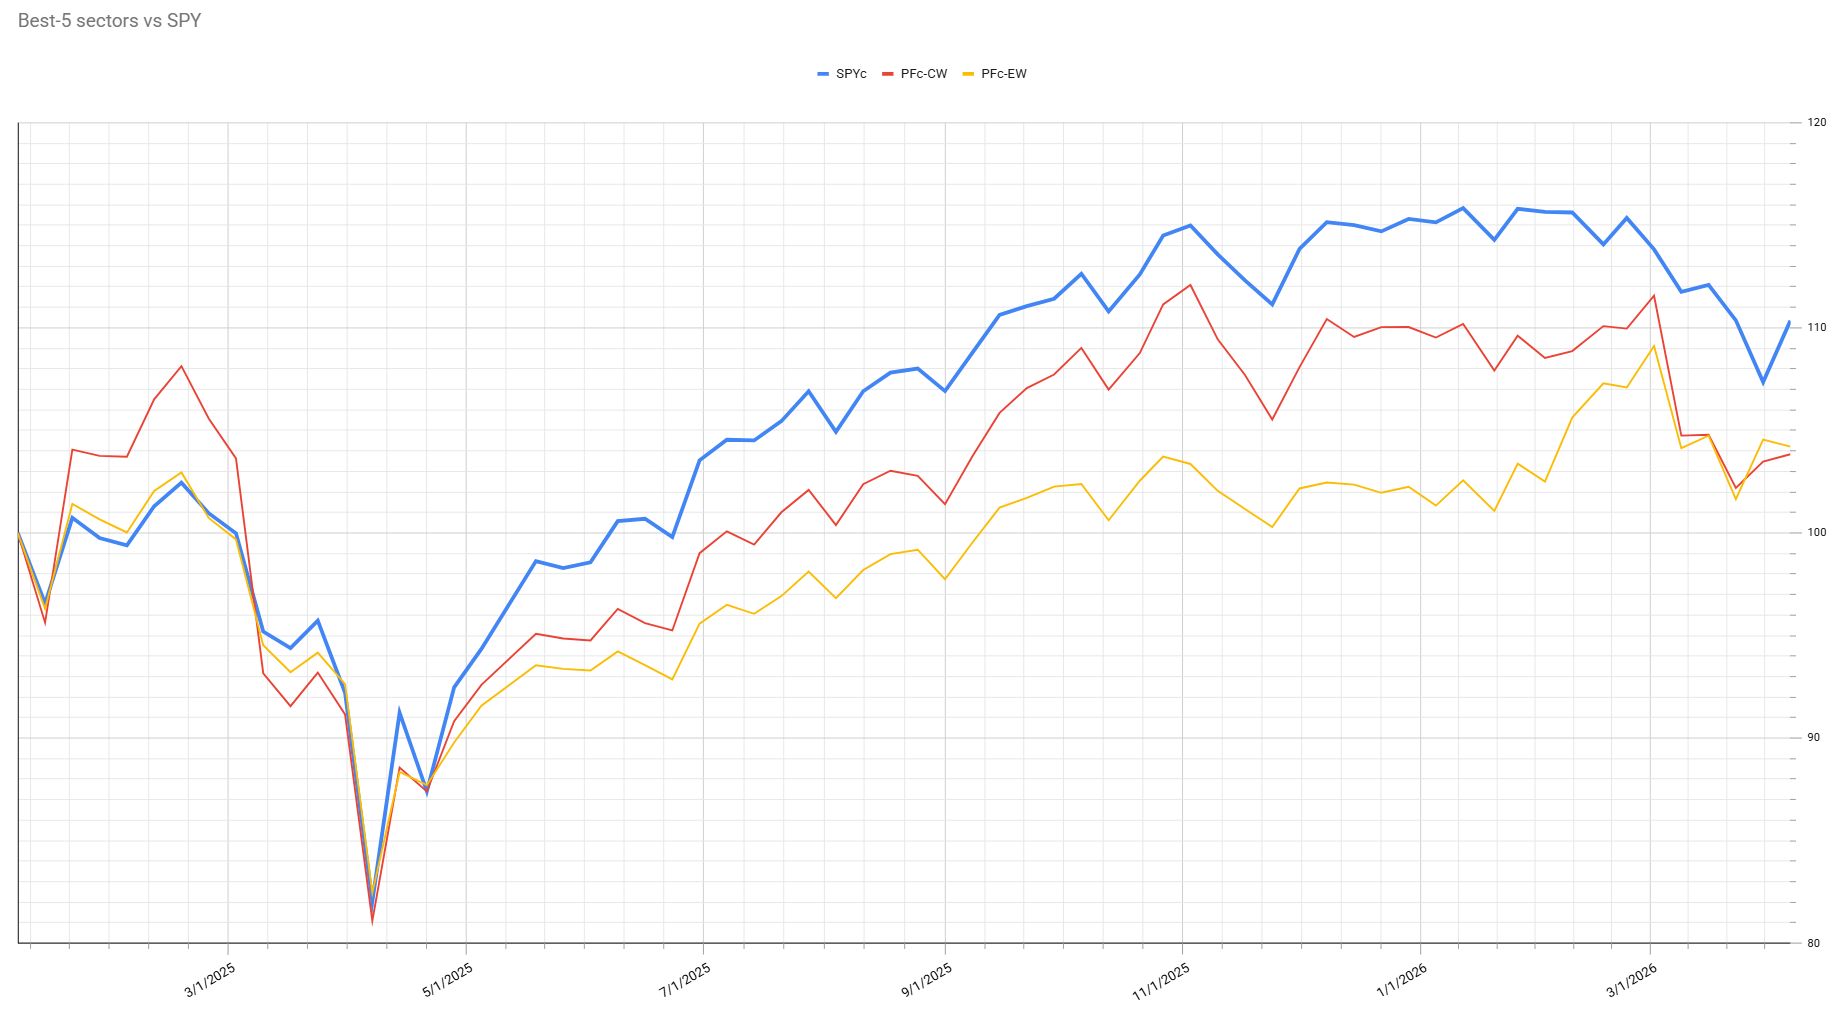
The strong week for the S&P 500 resulted in a weaker week for defensive portfolios, widening the underperformance gap to about five or six percent for both cap-weighted and equal-weighted portfolios. This is due to the recent surge in the S&P 500. However, given the current defensive composition of the top five sectors, a weaker market would likely benefit these portfolios, as they are positioned to outperform in such periods.
For this edition, two additional charts have been included to show the outperformance of the cap-weighted and equal-weighted portfolios over time.
Cap-Weighted Portfolio
Equal-Weight Portfolio
#StaySafe,--Julius