Bitcoin Fails at a New All-Time High; What’s Next?

Earlier this summer, I pointed out that Bitcoin had experienced a bearish shooting star on the day it experienced a new all-time high, and noted that this probably foreshadowed some short-term weakness. I pointed out that no damage whatsoever had been done to the basic uptrend, as the consensus of longer-term indicators remained in a bullish mode. My preference was to think of the situation in terms of dominoes, the first of which may have fallen with the shooting star. I continue to feel that way, even though it was not followed by much in the way of downside action.
Last week, however, another, more impressive domino fell, suggesting more of an intermediate correction lies ahead. That possibility is also supported by seasonal factors (Figure 1), which show that August and September have been the weakest two months for Bitcoin since 2014. However, until long-term technical benchmarks, such as a negative 12-month MA crossover or some key trendlines, are breached, it still makes sense to remain positive on the main trend.
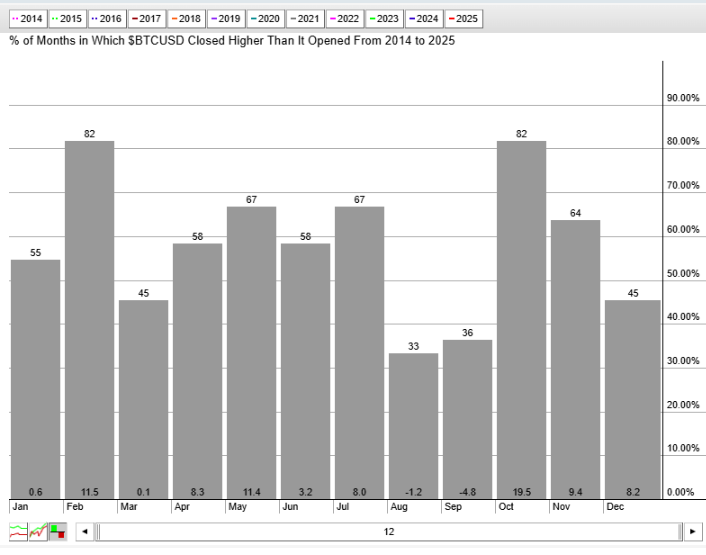
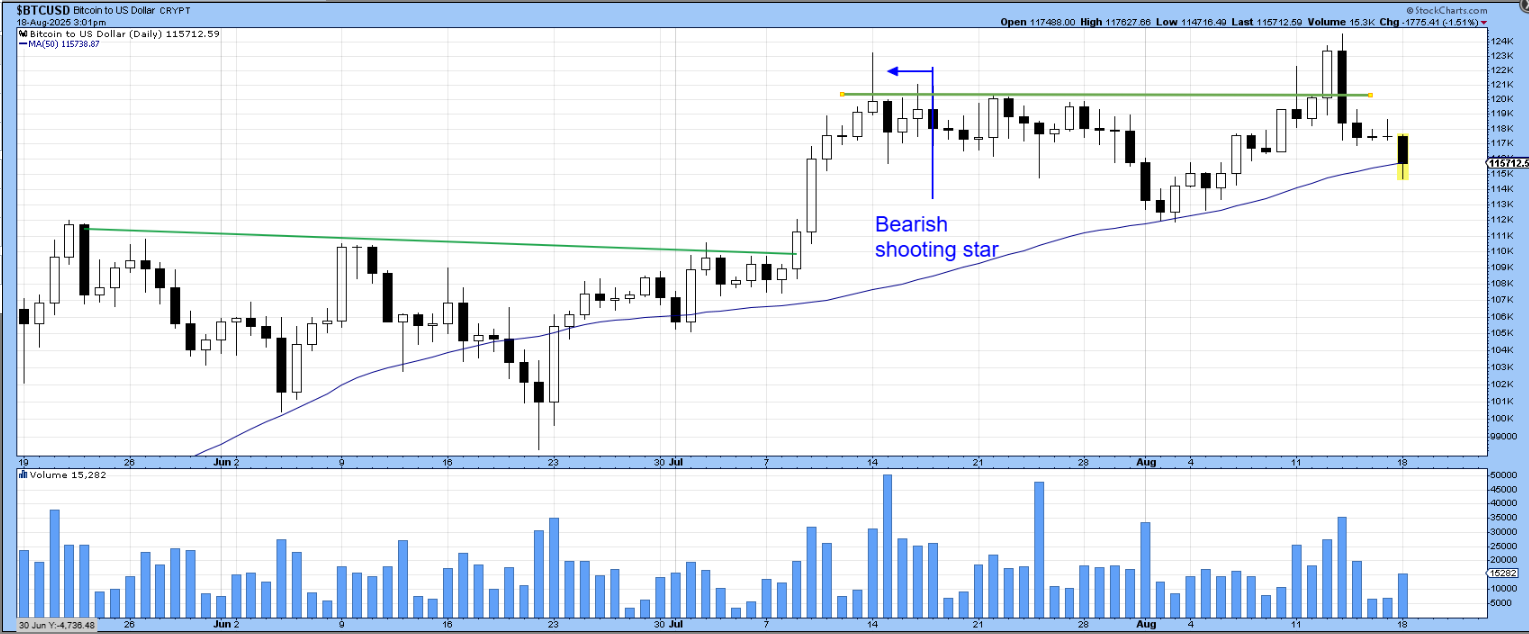
Chart 1, featuring daily candles, displays our original domino, taking the form of a bearish shooting star. Shooting stars develop after a short-term run-up in which prices are pushed to new intraday highs. However, the open and close are barely able to form above the session's low. They reflect exhaustion, since buyers run out of steam and are unable to support prices at these higher levels. Like most candle patterns, shooting stars produced from daily data are expected to have a negative effect over the short-term, say around 5-10 days, though their intraday highs in many instances may not be bettered for several weeks or more.
This one did not turn out to be a domino, because its high was taken out about a month later.
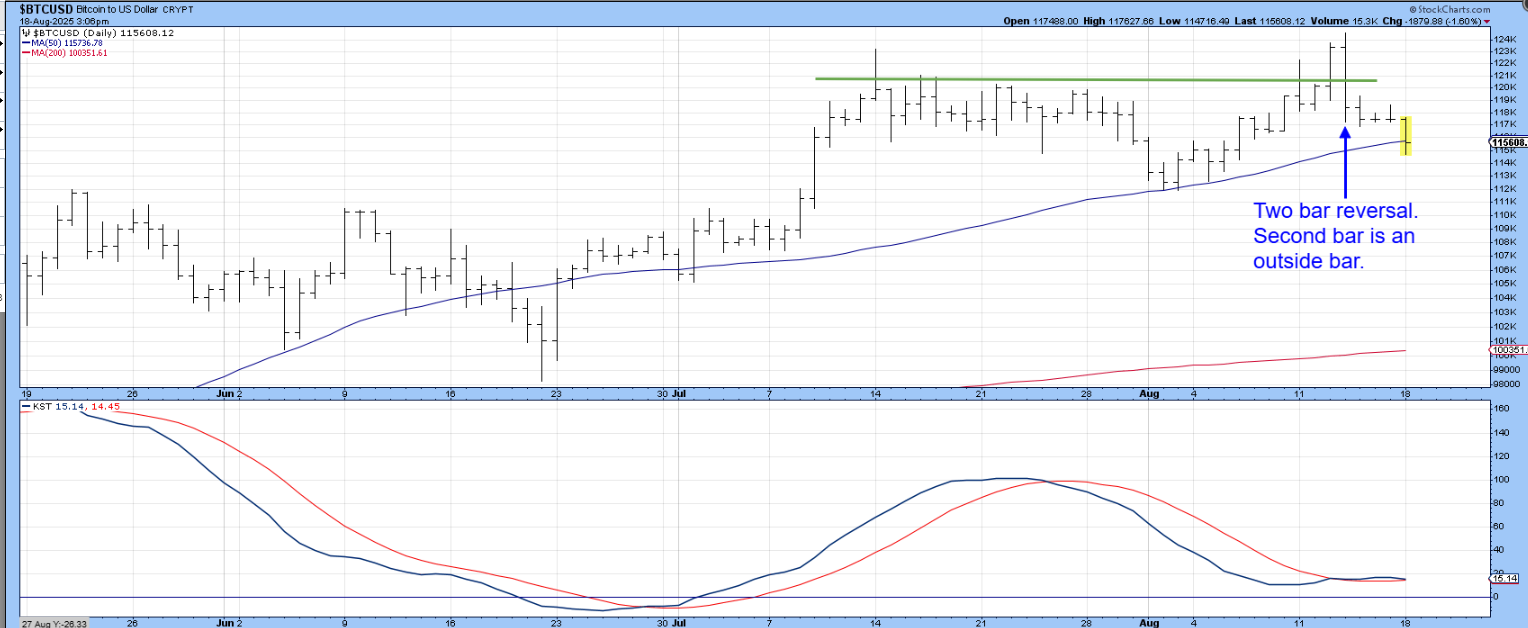
However, Chart 2 shows that the breakout turned out to be spurious. More to the point, the breakout took the form of a bearish two-bar reversal. These patterns are formed when the first bar opens near its low and closes near its high, whereas the second reverses the process by opening near its high and closing near its low. This leaves virtually everyone who bought in those two sessions with a loss. In this case, the second bar adds to the significance of the pattern, because its trading range totally encompasses that of the first, meaning it also qualifies in its own right as a bearish outside day. Individual outside days enhance their significance when they are particularly wide compared to their predecessors, as that reflects a bigger battle between buyers and sellers. More bonus points are added if it is accompanied by heavy volume, as that also reflects a significant battle. Last week’s outside bar qualifies on both counts, along with the fact that it formed part of a failed breakout.
That said, it is worth remembering that market prices are determined by the collective attitudes of market participants, and people can and do change their minds. A rally that holds above the outside bar’s intraday high in the next few days would cancel it as a bearish factor, actually enhancing the bullish case.
One- and two-bar reversal patterns certainly do not represent a primary bear market signal. They should also be confirmed by some kind of a price trend break, which did not happen in the case of the shooting star. However, the position of last week’s two-bar reversal/outside bar does open the question as to whether it could do sufficient damage that would result in some delicately balanced longer-term indicators tipping over.
In that respect, Chart 3 shows that both the Bitcoin price and its 25-day ROC are delicately balanced above two important trendlines. Note that the All-Time High registered last week was accompanied by an alarmingly low momentum peak. When confirmed by price, such striking divergences are often followed by above-average price moves. In this case, the 50-day MA is currently trading around $11,500.
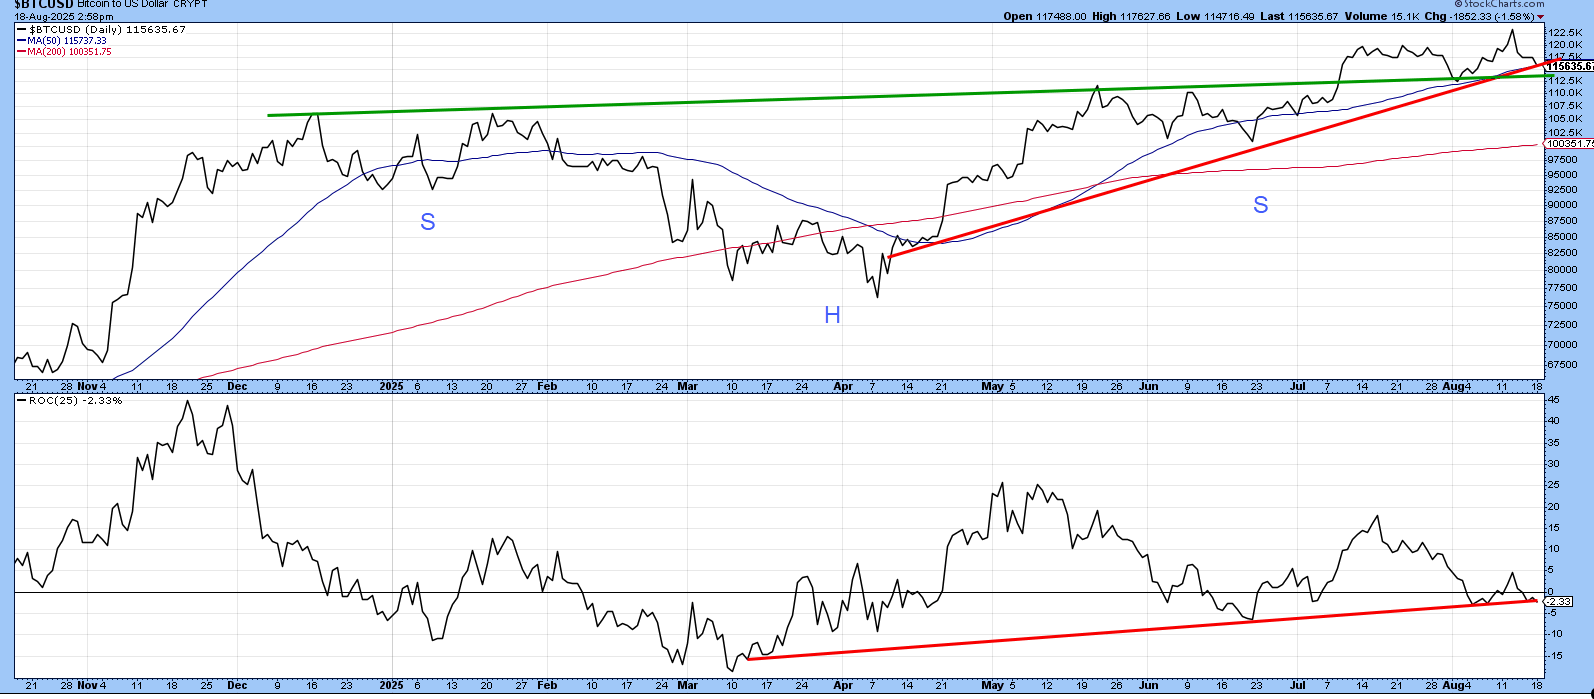
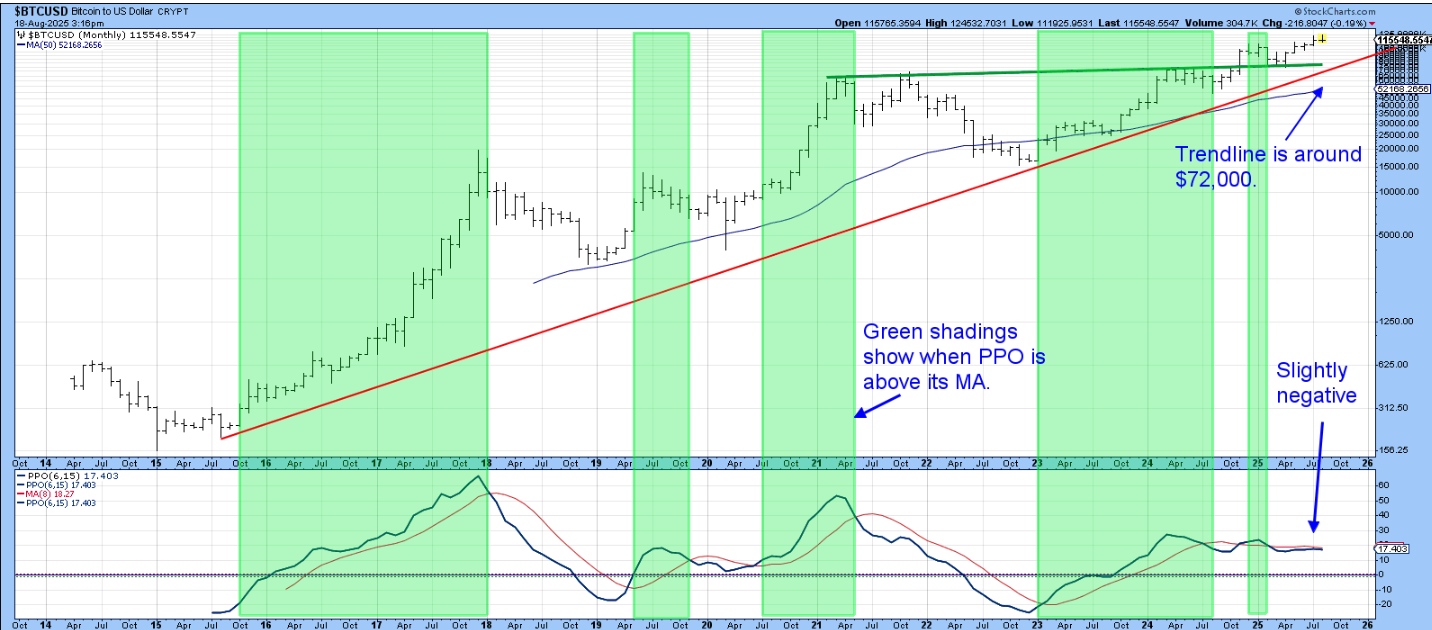
Chart 4 shows that the price is comfortably placed above its MA and the two converging trendlines. However, momentum is precariously balanced below its MA and could easily suffer a more decisive crossover. That would not necessarily be negative, but it is important to note that the vast majority of bear markets developed in the unshaded periods when the PPO was trading under its average.
Good luck and good charting,
Martin J. Pring
The views expressed in this article are those of the author and do not necessarily reflect the position or opinion of Pring Turner Capital Group of Walnut Creek or its affiliates.


