Bitcoin Takes One More Step to Signal a Primary Bear Market

The last time I wrote about Bitcoin was in August, when the price had experienced an outside bar, which itself was part of a bearish two-bar reversal. For reference purposes, that pattern formed at the tip of the orange arrow in Chart 1.
My conclusion at the time was that this action was likely to be followed by a period of weakness. On the other hand, I also opined that no damage had been done to the basic uptrend, as the consensus of longer-term indicators remained in a bullish mode. My inclination was to think of the situation in terms of dominoes, the first of which may have fallen even earlier with a July shooting star (flagged by the brown arrow) and the second by the two-bar/outside bar reversal. The third would have come at the beginning of October, when the price experienced a false breakout above the green trendline. The latest and fourth domino is the more consequential completion of the head-and-shoulders top.
The RSI and daily KST show that the price is very oversold short-term, and that it has already achieved the indicated minimum downside objective, which should act as support. No guarantees, but an oversold market that reaches support usually bounces. A longer-term factor currently weighing on the market is the recent negative 200-day MA crossover by the 50-day MA. But what are the other long-term indicators saying?
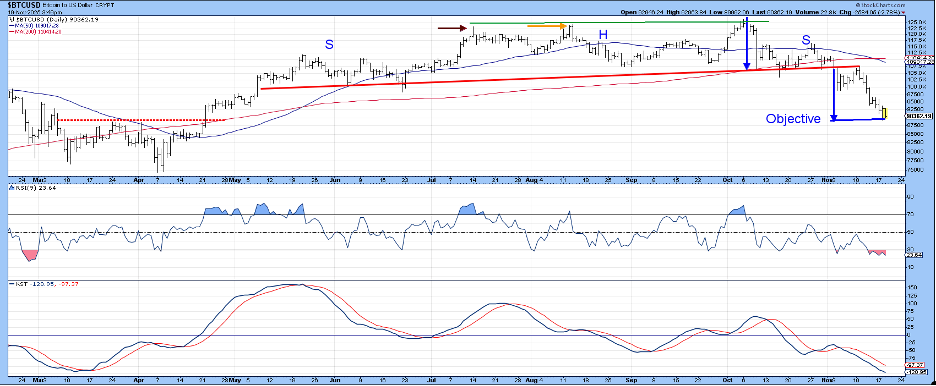
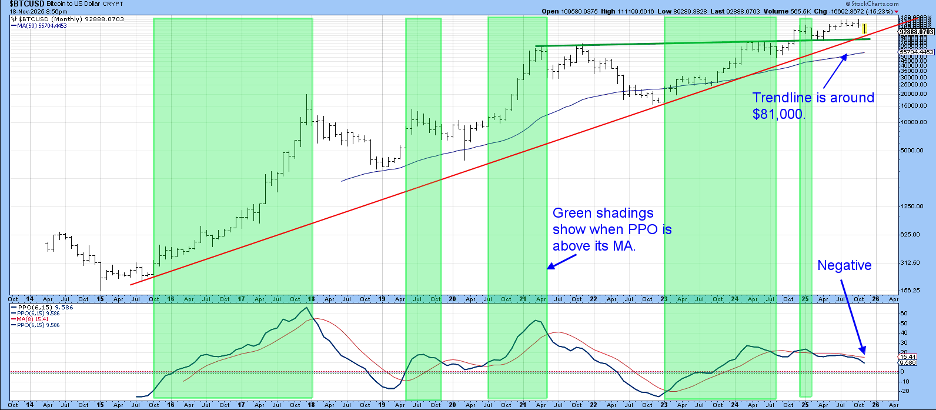
Chart 2 features a PPO using the 6- and 15-month parameters. The green shading indicates periods when this oscillator trades above its eight-month MA. This does a good job of isolating the major rallies. Equally as important are the unshaded areas when the indicator is below its average; these capture most of the important declines, so it’s no surprise that this approach is currently bearish.
The chart also indicates that the price is very close to its secular up trendline, estimated to be around $81,000. One final takeaway lies in the fact that the price broke out from a huge inverse head-and-shoulders formation in late 2024. On the face of it, we have recently witnessed a normal pullback to the breakout point. However, if the price drops below those two trendlines, a normal retracement move would transition to a bear market instead.
The price of Bitcoin has been rising in a spectacular and unprecedented fashion. However, momentum underlying that performance has been gradually dissipating. We can see this in Chart 3, where, starting in late 2017, the price experienced a series of rising peaks. However, it was accompanied by a 26-week ROC that traced out a series of declining ones. Indeed, the indicator barely pushed above zero at peaks 4 and 5.
Because there is no reason why the series of negative divergences cannot be extended before the price drops, we look for it to confirm such weakness. In that regard, the recent violation of the 2023–2025 up trendline is a good starting point. However, the real confirmation would come from a violation of the red line in Chart 2, because it is significantly longer.
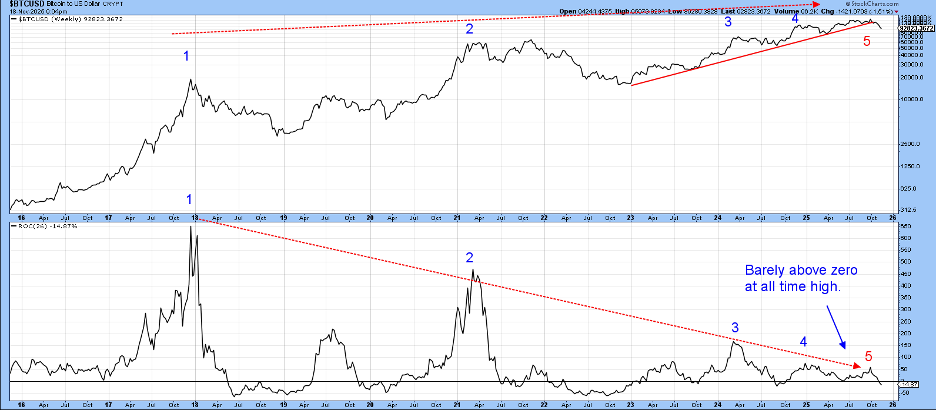
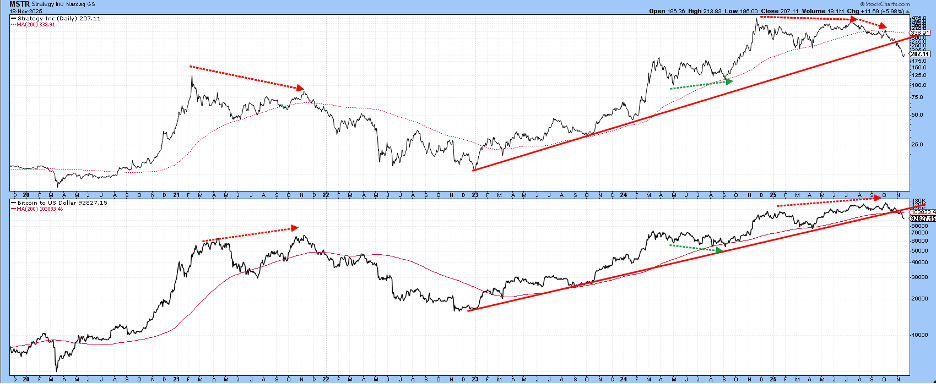
Chart 4 compares the Bitcoin price to that of Strategy Inc. (formerly MicroStrategy), a company that offers a means to play the market in a more leveraged way. The dashed arrows isolate negative and positive divergences between the two series. In 2021, for example, Strategy failed to confirm a new Bitcoin high, and this setup was followed by a decline. In the last few months, a more serious discrepancy has developed, and both series have confirmed with important trendline violations. Such action is likely to curtail the potential for a likely short-term rally and may even be followed by a multi-month trading range.
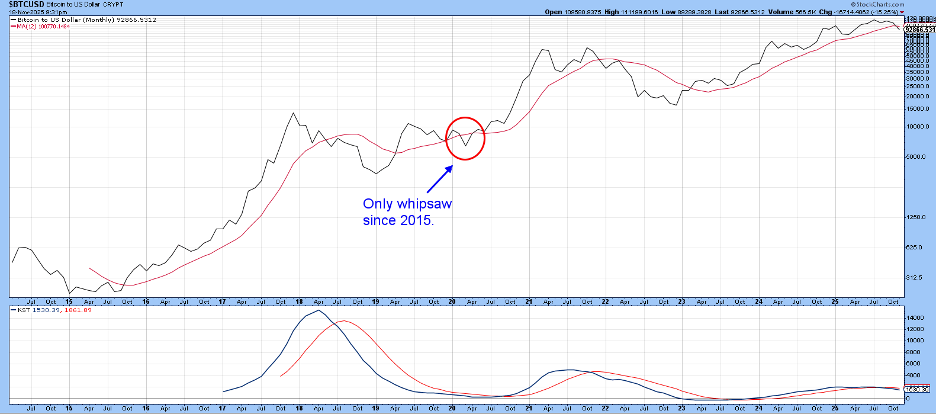
That view is also supported by Chart 5, which shows that the price has fallen below its 12-month MA and the long-term KST has gone bearish. The ellipse draws attention to the fact that there has only been one false 12-month MA crossover in the last eight years. The average is currently around $100,000, so if Bitcoin is unable to regain it by the end of the month, a primary bear market would be the most likely outcome, especially if that long-term up trendline in Chart 2 is decisively violated.
Good luck and good charting,
Martin J. Pring
The views expressed in this article are those of the author and do not necessarily reflect the position or opinion of Pring Turner Capital Group of Walnut Creek or its affiliates.


