Bonds Still Underperforming, Best Sectors for Hunting, IWM Starts to Leads SPY, Healthcare and Biogen Perk Up
Key Takeaways
- TLT breaks out, but is still underperforming SPY.
- Arthur explains how to find the best "hunting grounds" for sectors.
- The Russell 2000 ETF has started to outperform SPY.
- Healthcare is looking healthy again; Biogen has finally turned the corner.
TLT Breaks Out, But Still Not Outperforming SPY
The 20+ Year Treasury Bond ETF (TLT) broke out with a big surge in September (+4.32% in seven days), which is the biggest 7-day surge since the Yen carry-trade fiasco in early August 2024. TLT reversed its downtrend as it broke resistance and the 200-day SMA. Long-term bonds represent the safe-haven of risk-off trade. Even though money is moving into bonds, this is not a problem for stocks because TLT is still underperforming SPY.
The trouble starts when TLT starts outperforming SPY.
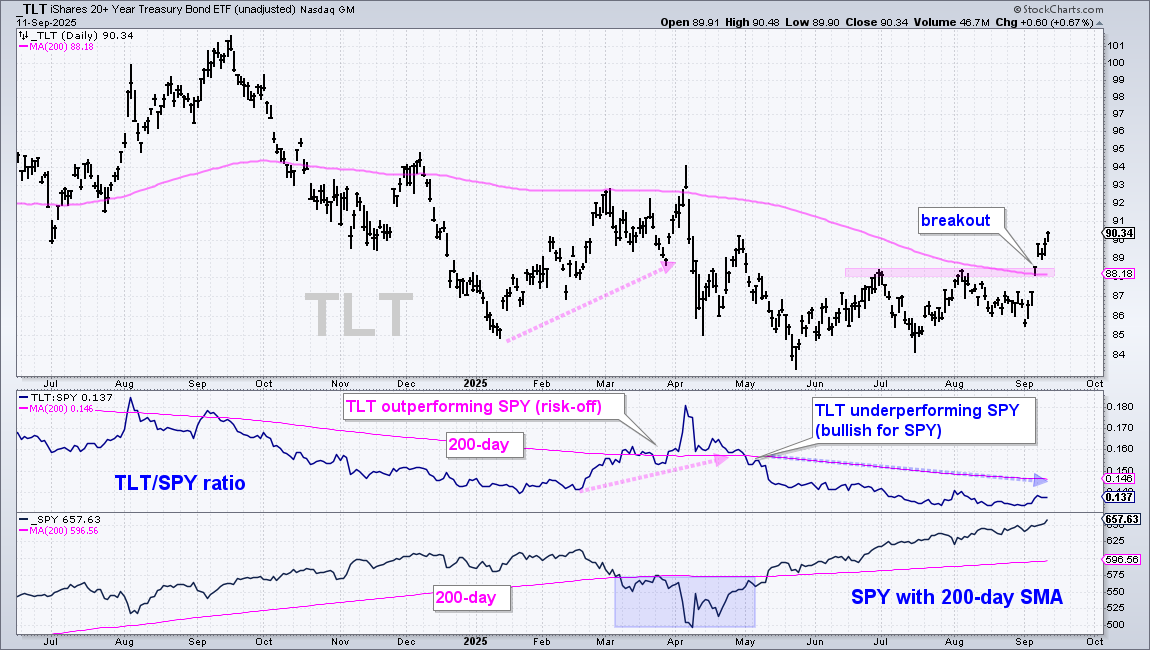
On the chart above, the middle window shows the TLT:SPY ratio turning up in late February, rising into March and surging in early April. TLT outperformed SPY during this period. In the bottom window, SPY moved below its 200-day SMA in early March and fell sharply into April. The risk-on trade returned when the TLT/SPY ratio broke below its 200-day SMA in early May and moved sharply lower into mid May. SPY also broke back above its 200-day SMA in mid-May.
Currently, the TLT/SPY ratio is still below its 200-day SMA and favoring stocks. A break above the 200-day SMA would show a preference for bonds; this could be negative for stocks.
Finding the Best Hunting Grounds
Indexes and sectors with the most stocks in long-term uptrends show the most internal strength. These are good hunting grounds for individual stocks. Chartists can find the indexes and sectors with the strongest internals using the percentage of stocks above their 200-day EMAs. On the table below, the S&P MidCap 400 is the index with the highest percentage of long-term uptrends (71%). Within the sectors, Consumer Discretionary, Industrials and Utilities are the strongest, with over 80% of component stocks above their 200-day EMAs.
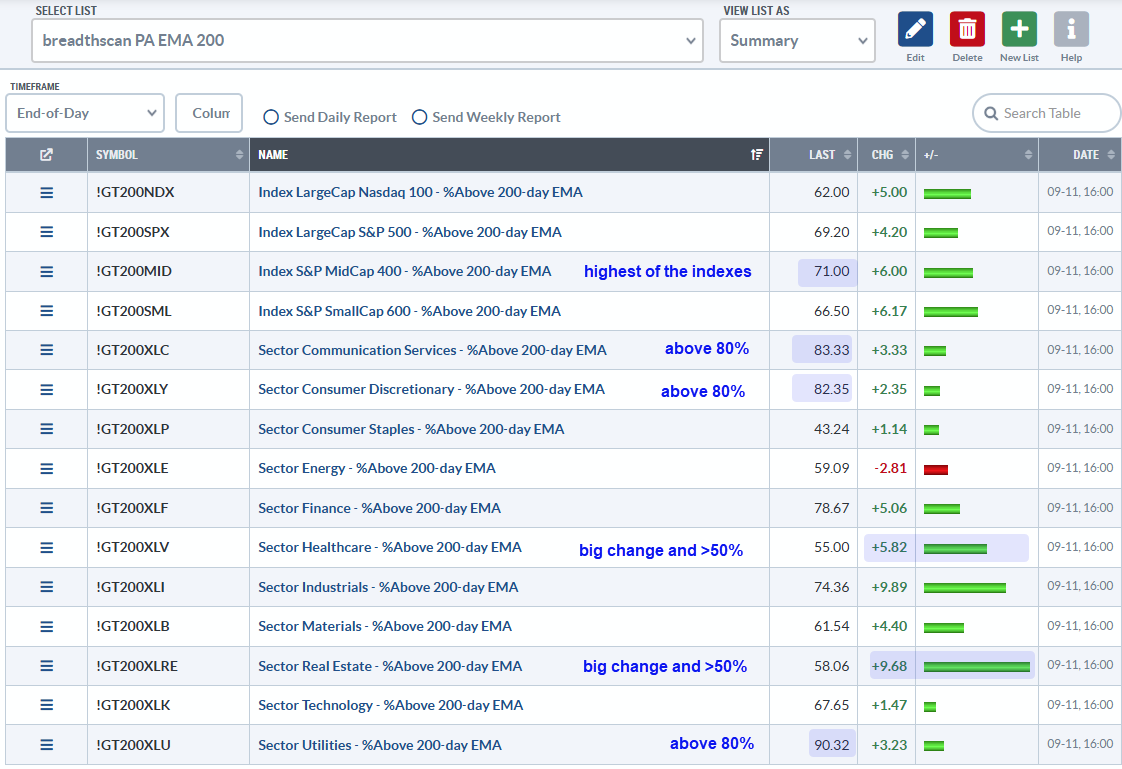
Chartists can also watch for sectors with the biggest change to find emerging leaders. For example, Healthcare and REITs were both below 50%, but surged above 50% as more stocks crossed above their 200-day EMAs.
Recent reports and videos at TrendInvestorPro:
- Five Flag Breakouts with Follow Through
- Market Conditions in One Chart
- Utes and Healthcare Break Out as Bitcoin Sets Up
- Nasdaq 100 Breadth Stinks, but QQQ Does Not Care
- Stock Setups: Two Defense Stocks and a Biotech
Click here to take a trial and gain full access.
Russell 2000 ETF Starts to Outperform SPY
The Russell 2000 ETF (IWM) is taking the lead in August and finally starting to outperform SPY, the large-cap driven S&P 500 ETF.
The chart below shows IWM breaking out in early June and working its way higher into September. IWM is closing in on its late November high, which was the last 52-week high. I do not consider this resistance, so a break above this high would not be a "breakout" in my book. Why? Because the long-term trend is up and higher highs are expected during uptrends. The true breakouts occurred on June 6th, when the long-term downtrend reversed, and on August 12th, when IWM broke out of a consolidation. A break above the November high would, however, be a milestone, as it would mark a 52-week high and confirm the uptrend.
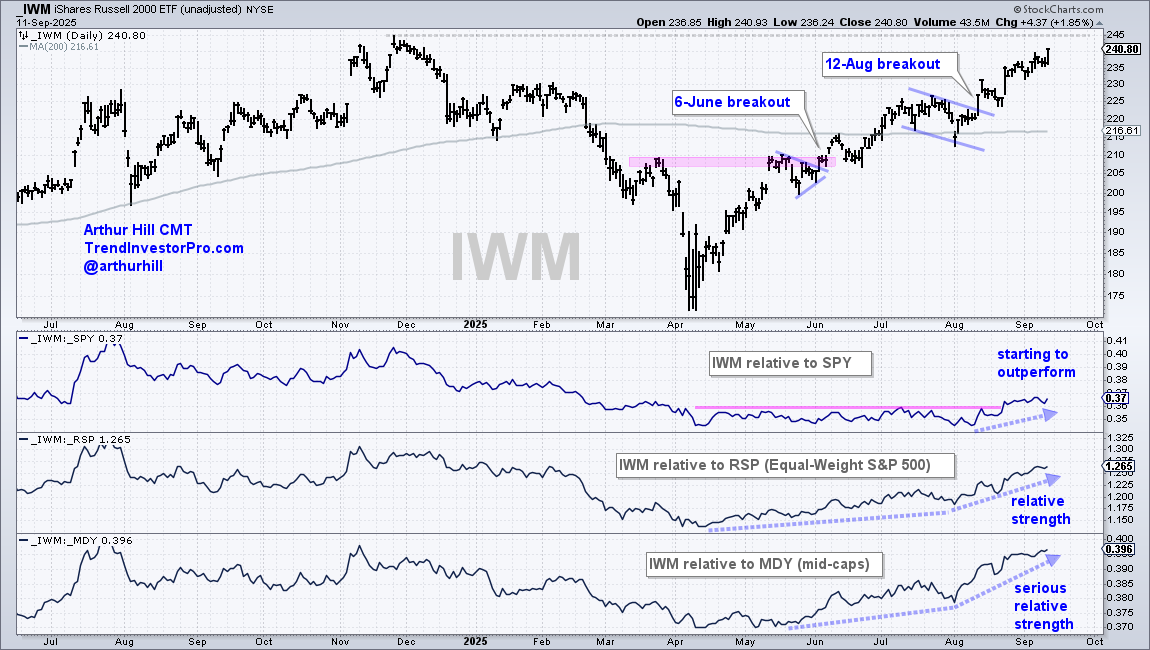
The bottom windows show three relative performance lines. First, we have IWM relative to SPY (IWM/SPY). IWM is just now starting to outperform SPY with a relative breakout in late August. In the middle window, IWM is outperforming the S&P 500 EW ETF (RSP) since early August. In the lower window, IWM is seriously outperforming the S&P MidCap 400 SPDR (MDY) as the price-relative moved sharply higher the last seven weeks (serious relative strength).
Healthcare is Looking Healthy Again
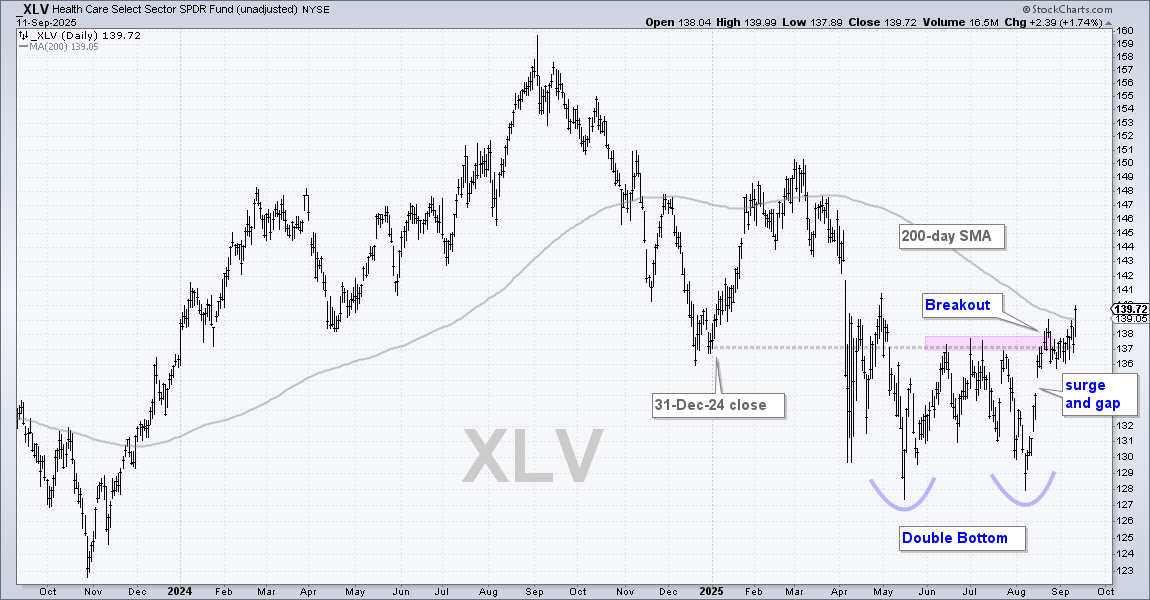
The Healthcare SPDR (XLV) has been on my radar since late July, which is when it became extremely oversold (see report here). Since then, the ETF traced out a classic Double Bottom and broke out in late August. The chart below shows two lows in the 128 area, resistance in the 137-138 area, and a surge above resistance. These lows mark areas of demand, while resistance marks an area of supply. The resistance breakout confirms the Double Bottom and signals that demand overpowered supply. Short-term, XLV stalled around the breakout zone for a few weeks and then moved above its 200-day SMA this week. Also note that XLV is finally positive year-to-date with a 1.56% gain!
Biogen Finally Turns the Corner
It has been a rough two years for Biogen (BIIB), but the stock appears to be reversing its long-term downtrend as the Trend Composite moved to +3 this week. The Trend Composite aggregates trend signals in five trend-following indicators. A reading of +3 means four are bullish and one bearish (4-1 = 3).
The chart below shows the Trend Composite in the middle window. It turned negative in July 2023 and signaled a downtrend until August 2025, when it turned positive for a few days. Trend-following indicators are prone to whipsaw, and the first signal resulted in a whipsaw as the Trend Composite turned negative. This signal did not last long either, as the Trend Composite turned positive on September 2nd (+1). With further strength on Thursday (+4.42%), the Trend Composite hit +3 to confirm the trend reversal.
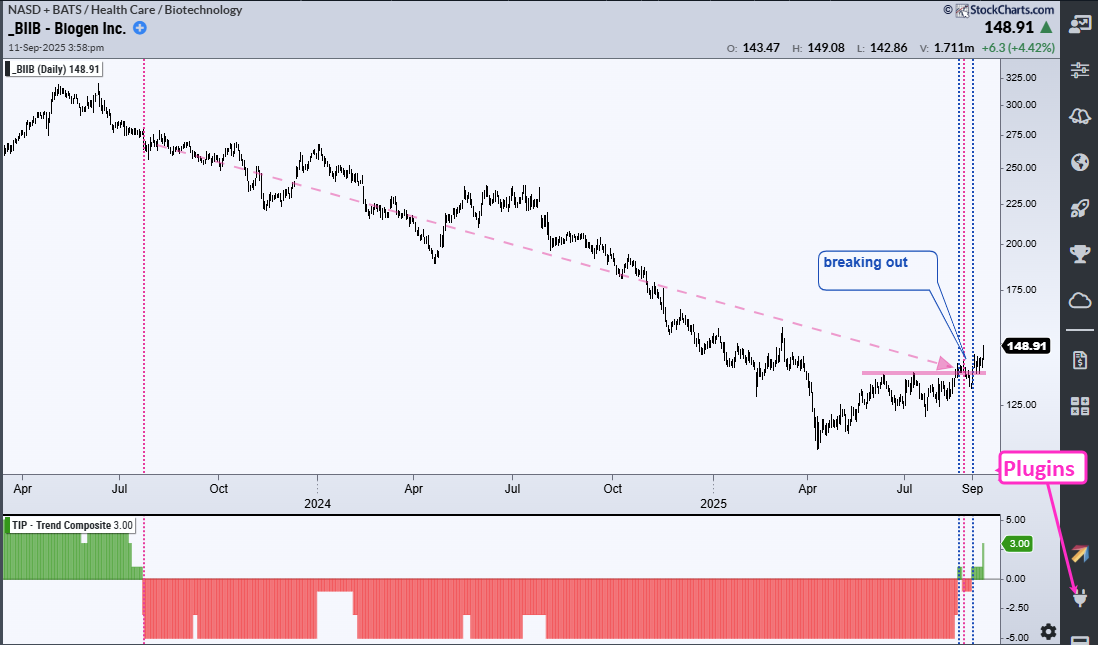
The Trend Composite is one of 11 indicators in the TIP Indicator-Edge Plugin for StockChartsACP. Click here to learn more.
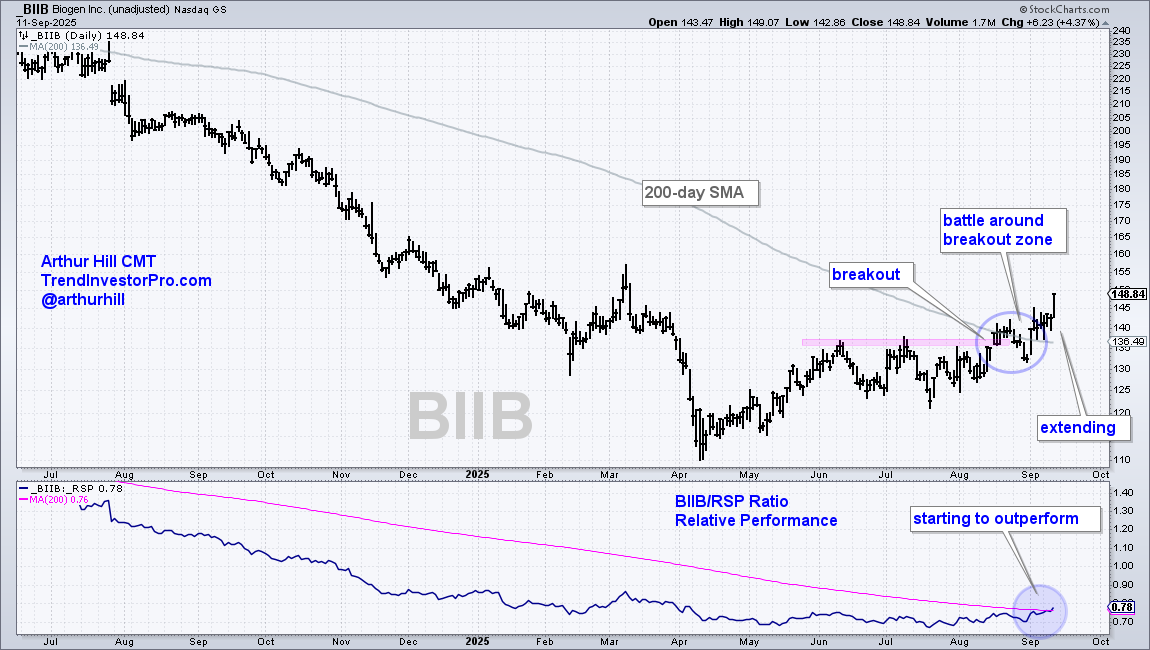
The next chart shows daily bars for BIIB with the price-relative (BIIB/RSP ratio) in the lower window. The stock broke resistance (pink shading) and the 200-day SMA in mid-August, but this breakout did not last as a battle unfolded. This is not uncommon. After a dip into late August, the stock surged in early September and extended on the breakout. This bullish price action confirms the trend reversal. In the lower window, the price-relative is also turning up as relative performance improves.
See TrendInvestorPro for more chart analysis and videos.


