Broadening Trade Benefits Small-Caps and Non-Tech, But Don't Count XLK Out Just Yet
Key Takeaways
- Relative strength in small-caps vs. large-caps is broadening out.
- Since late November, Industrials and Materials have been the strongest sectors.
- Vulcan Materials, a stock in the leading sectors and industry groups, is showing signs of a potential move higher.
The bull market started broadening in late November, and this process continued into 2026. This year, we are seeing breakouts in the Home Construction ETF (ITB), Retail SPDR (XRT), and Regional Bank ETF (KRE). Small-caps are leading large-caps while the materials sector is leading the tech sector. All is not lost for the Technology Select Sector SPDR (XLK), though, with it just now consolidating after a massive advance. The Industrials SPDR (XLI) is picking up the slack and the Materials SPDR (XLB) moved into the lead. Lastly, there's a materials stock that is now making a break for it.
Small-Caps Lead Large-Caps
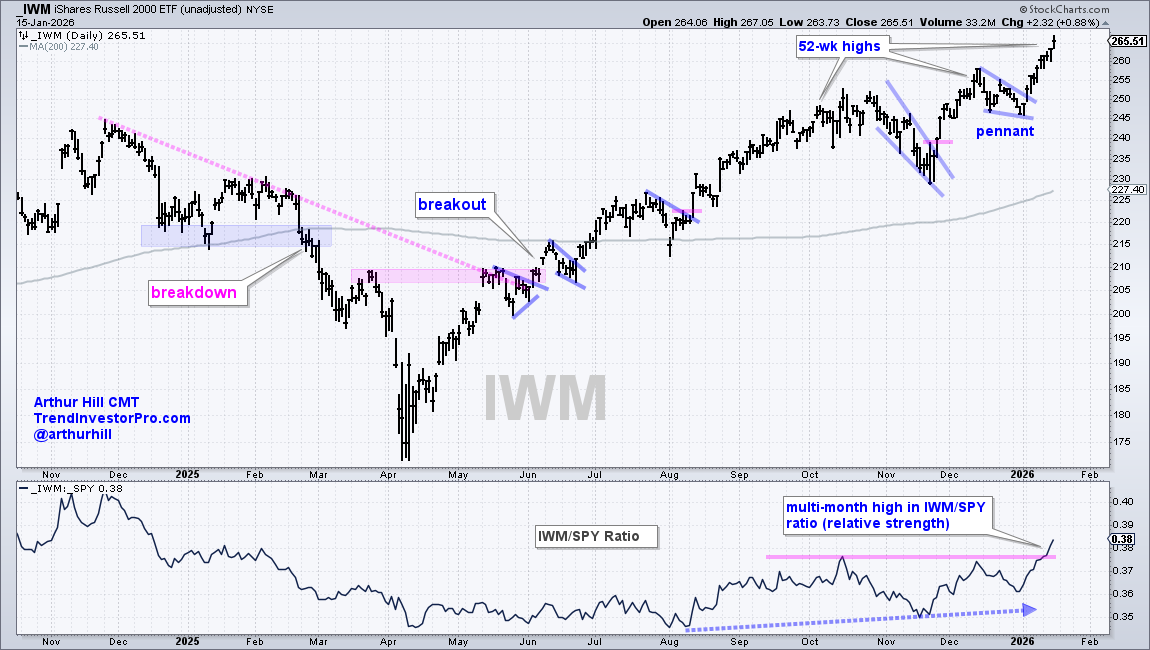
Small-caps are leading large-caps this year and over the last six months. Relative strength in small-caps means the bull market is broadening out. The S&P 500 SPDR (SPY) is up around 12% the last six months, while the Russell 2000 ETF (IWM) is sporting a 22% gain, almost twice as much. In addition, IWM is up 7.86% year-to-date while SPY is up just 1.51%. SPY is still in an uptrend, but IWM is clearly the stronger of the two.
The chart below shows IWM hitting new highs in October, December, and January. Most recently, IWM formed a pennant in late December and broke out in early January.
Technology SPDR Consolidates Within Long-Term Uptrend
XLK remains below its late October high and has shown relative weakness in the last two months, but this key sector remains in a long-term uptrend. Keep in mind that XLK surged some 75% from April to October; the ETF is entitled to a rest after this massive advance. XLK hit new highs from late June to late October and remains above its rising 200-day SMA. In short, XLK is still in a long-term uptrend.
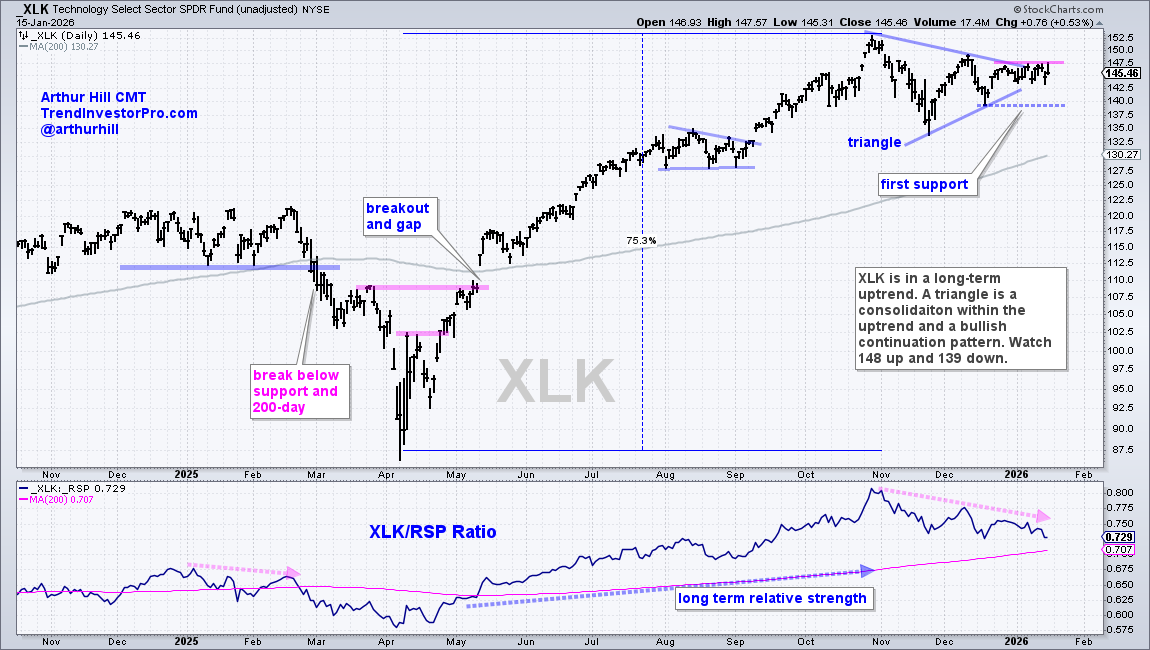
Medium-term, XLK consolidated with a triangle. Technically, a consolidation within an uptrend is a bullish continuation pattern. A breakout at 148 would be bullish and signal a continuation higher. The blue dashed line marks first support from the mid-December lows. A break here would negate the triangle and argue for more corrective price action.
Recent reports and videos at TrendInvestorPro:
- Performance Update for Momentum Strategies (ETFs, NDX, SPX)
- A W Bottom and Bollinger Band Setup for the Cybersecurity ETF
- Tradable Corrections in Two Cybersecurity Stocks
- A Blowoff Top for Silver and Key Levels for the Bitcoin Breakout
- Click here to take a trial and gain full access.
Industrial Sector Picks up the Slack
The Industrials SPDR (XLI) and the Materials SPDR (XLB) are the strongest sectors since late November. XLI is up around 12% the last 37 trading days and XLB advanced 16%. Note that I chose late November as my starting point because this is when the broadening began in earnest.
The chart below shows XLI becoming oversold as the Momentum Composite dipped to -5 on November 19th. This oversold reading marked the low as the ETF surged to a new high on December 11th. XLI continued higher into mid-January and remains a clear leader.
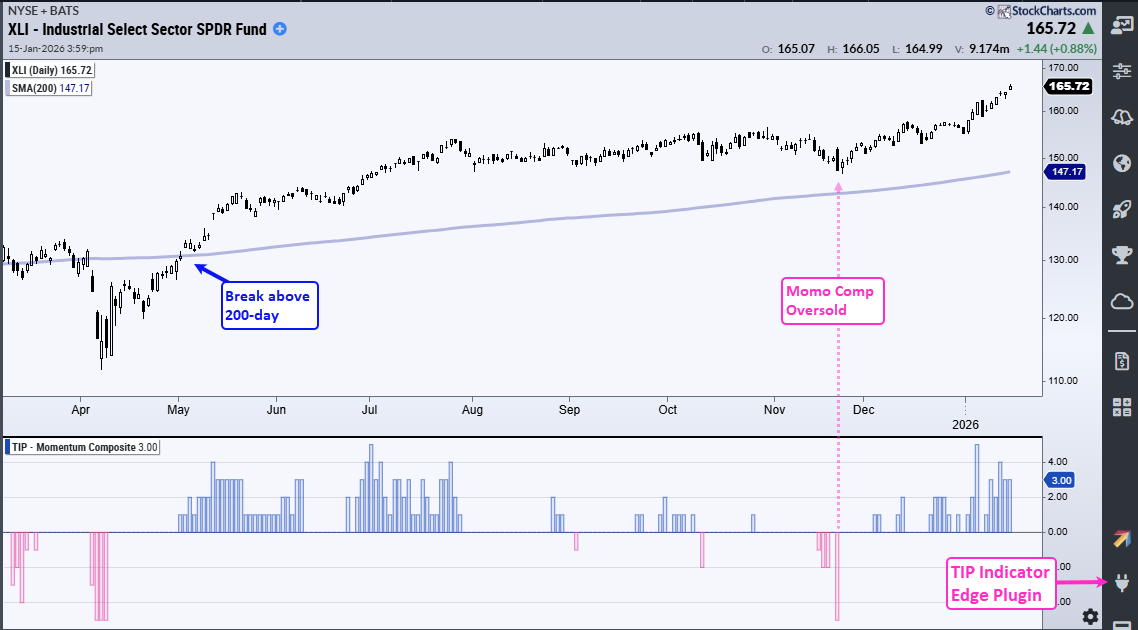
The Momentum Composite aggregates overbought and oversold readings in five momentum oscillators. A reading of -5 means all five indicators are oversold, as values between -3 and -5 signal oversold conditions. Oversold readings work best with names that are in long-term uptrends (above their rising 200-day SMAs). The Momentum Composite is one of eleven indicators in the TIP Indicator Edge Plugin. Click here to learn more.
Materials Sector Takes the Lead
The Materials SPDR (XLB) was dead weight from July to November, meandering near the 200-day SMA and going nowhere. This changed in late November as the ETF broke channel resistance. XLB became overbought here in January, but overbought conditions are expected in a strong uptrend.
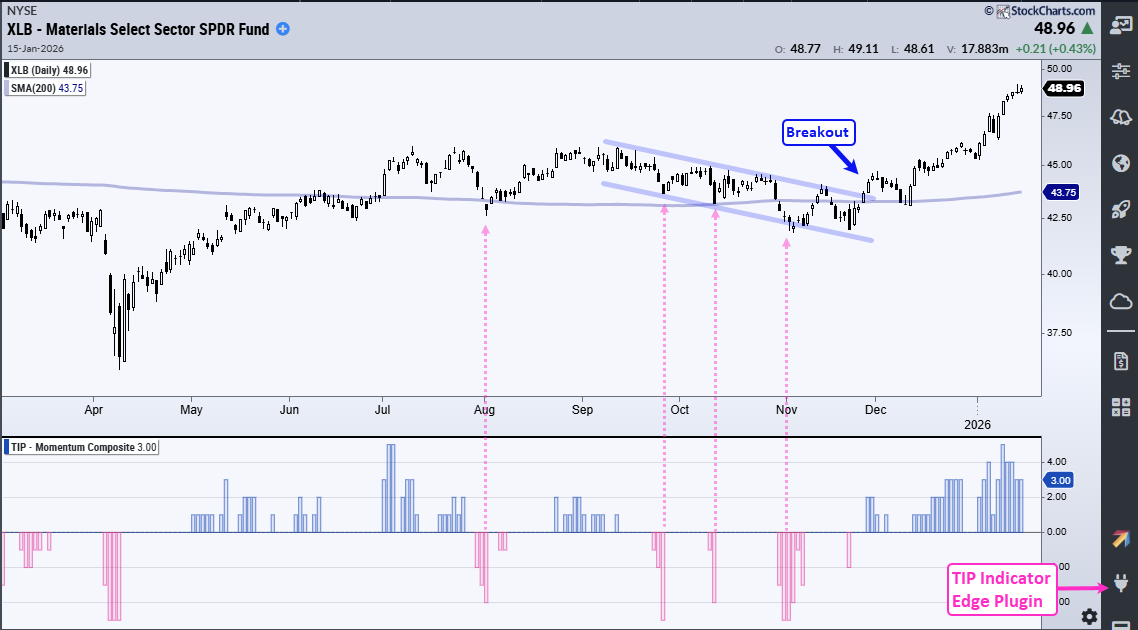
The lower window shows the Momentum Composite hitting 4 and 5 this year. Overbought readings within an uptrend are not really bearish, for two key reasons. First, the long-term trend is up. Second, it takes strong upside momentum to become overbought.
XLB is now at the top of my watchlist for oversold readings and tradable pullbacks. This is the main focus at TrendInvestorPro: finding tradable setups within leading uptrends.
Vulcan Materials Signals Continuation Higher
Chartists looking for individual stocks to trade can start with leading sectors and industry groups. Vulcan Materials (VMC) came to my attention after sifting through stocks in the Materials sector. First and foremost, the stock is in a long-term uptrend. VMC hit new highs in October and early January and remains above its rising 200-day SMA.
Medium-term, the stock consolidated with a triangle, which represents a rest within the long-term uptrend. VMC broke triangle resistance with a surge in early January. I view this breakout as bullish, as it signals an end to the consolidation and a resumption of the long-term uptrend. VMC fell back to the 300 area after this breakout. This was a throwback to the breakout zone, which turns to first support. A throwback offers a second chance to partake in the breakout.
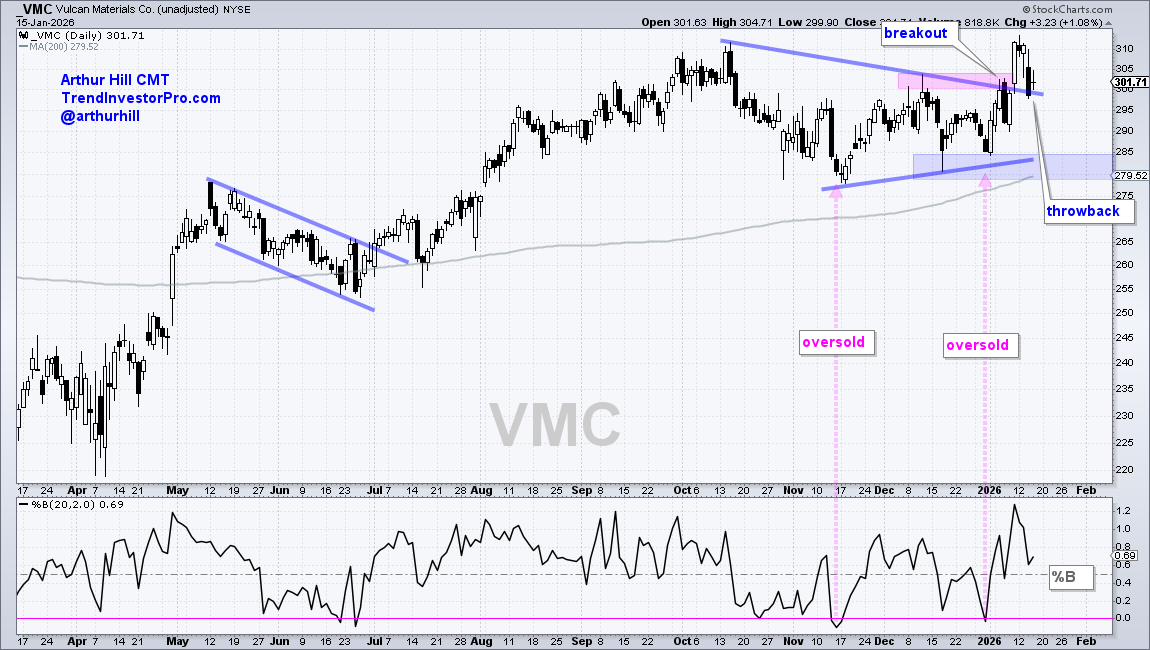
The indicator window shows %B (20,2) becoming oversold with a dip below zero in late December. %B dips below zero when the close is below the lower Bollinger Band (20,2). Note that %B is one of the five indicators in the Momentum Composite. The last December oversold reading foreshadowed the recent bounce and breakout.
See TrendInvestorPro for more reports and videos.


