Bullish Breakouts, Bearish Candles: What to Watch Next

This week brought some dramatic changes to the equity landscape, from the S&P 500 surging back above 6800 to impressive breakouts in the Magnificent 7 stocks. Once we identify strong breakouts, it’s important to follow the daily charts for any signs of short-term trend exhaustion.
Today, we’ll break down three charts that have experienced breakouts this week, but have also finished the week with bearish candle reversal patterns. While the primary trends on these charts still appear to be in place, the reversal patterns indicate a high likelihood of a tactical reversal.
VeriSign (VRSN): The Shooting Star Pattern
Technology firm VeriSign experienced a strong March, which propelled the stock off its February low of around $210. On Monday’s session, the stock surged up to $275, which was followed by further acceleration on Tuesday. By Tuesday’s close, though, the stock had closed down near the lows of the day.
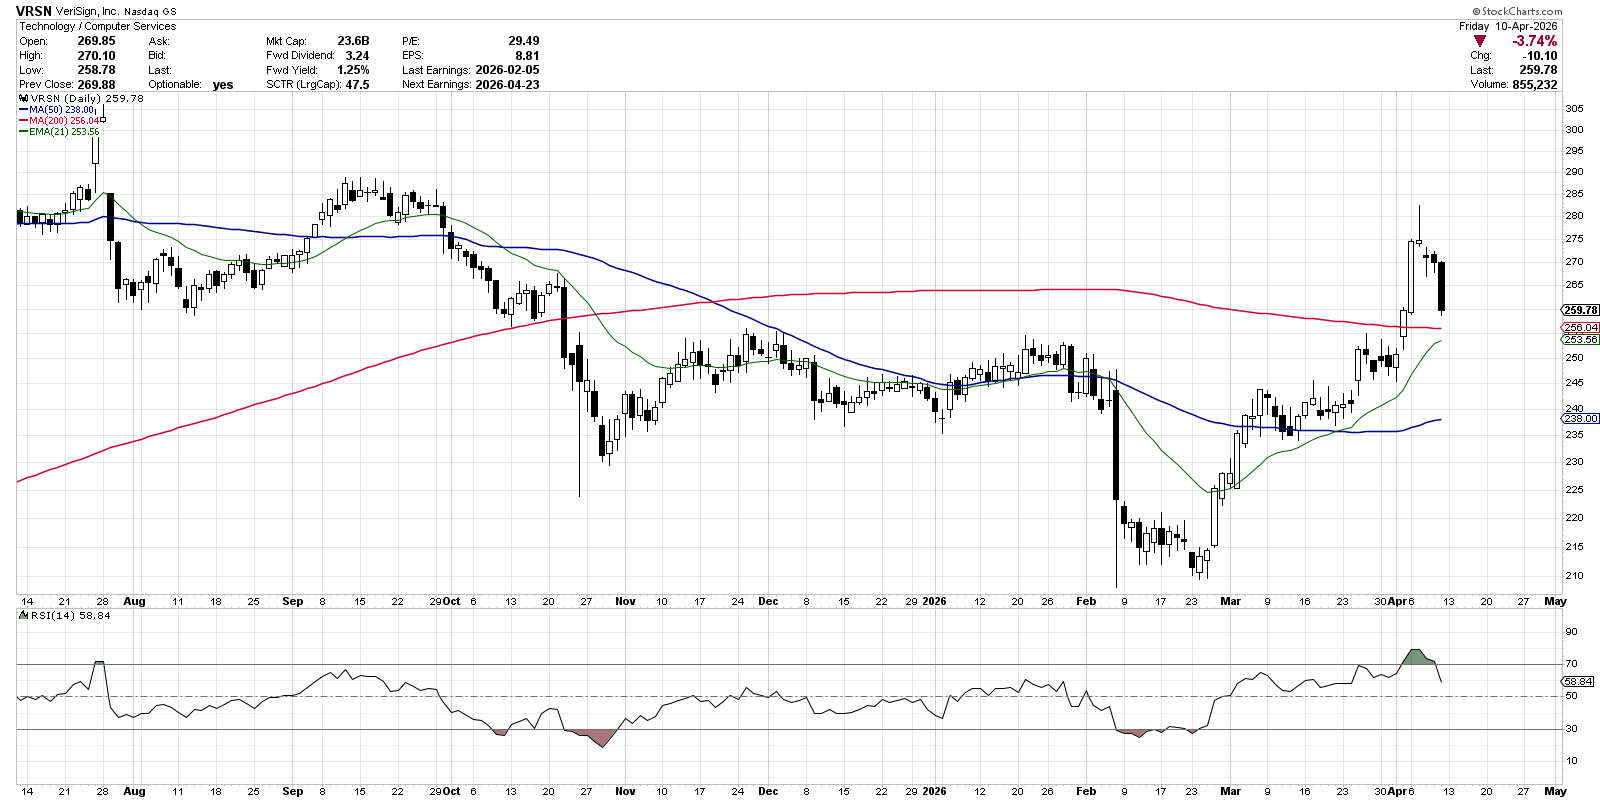
This shooting star candle on Tuesday, with a longer upper shadow and the open and close near the lows of the trading day, represents a short-term reversal. During the trading session, an initial rally off the open is sold off, leaving the stock right where it started going into the close.
Also note the overbought conditions at the beginning of the week, as VRSN showed an RSI above 70. While overbought conditions are often an encouraging long-term signal for stocks, in the short-term they can often lead to a short-term reversal. So it’s worth noting that shooting star candle, combined with the RSI overbought conditions, seemed to confirm a likely short-term price drop.
We can see that VRSN sold off after this shooting star pattern occurred, with Wednesday through Friday bringing a further 5% decline after Tuesday’s close. For this chart, we’re watching the 200-day moving average as a potential support level. Any confirmed move below the 200-day would suggest further deterioration for this computer services company.
Target (TGT): The Bearish Engulfing Pattern
The chart of Target has been fairly constructive into April, with the big box retailer retesting its previous peak around $126 in early March. But Friday’s down close after a strong up move on Thursday completes a bearish engulfing pattern, setting up for a potential short-term reversal next week.
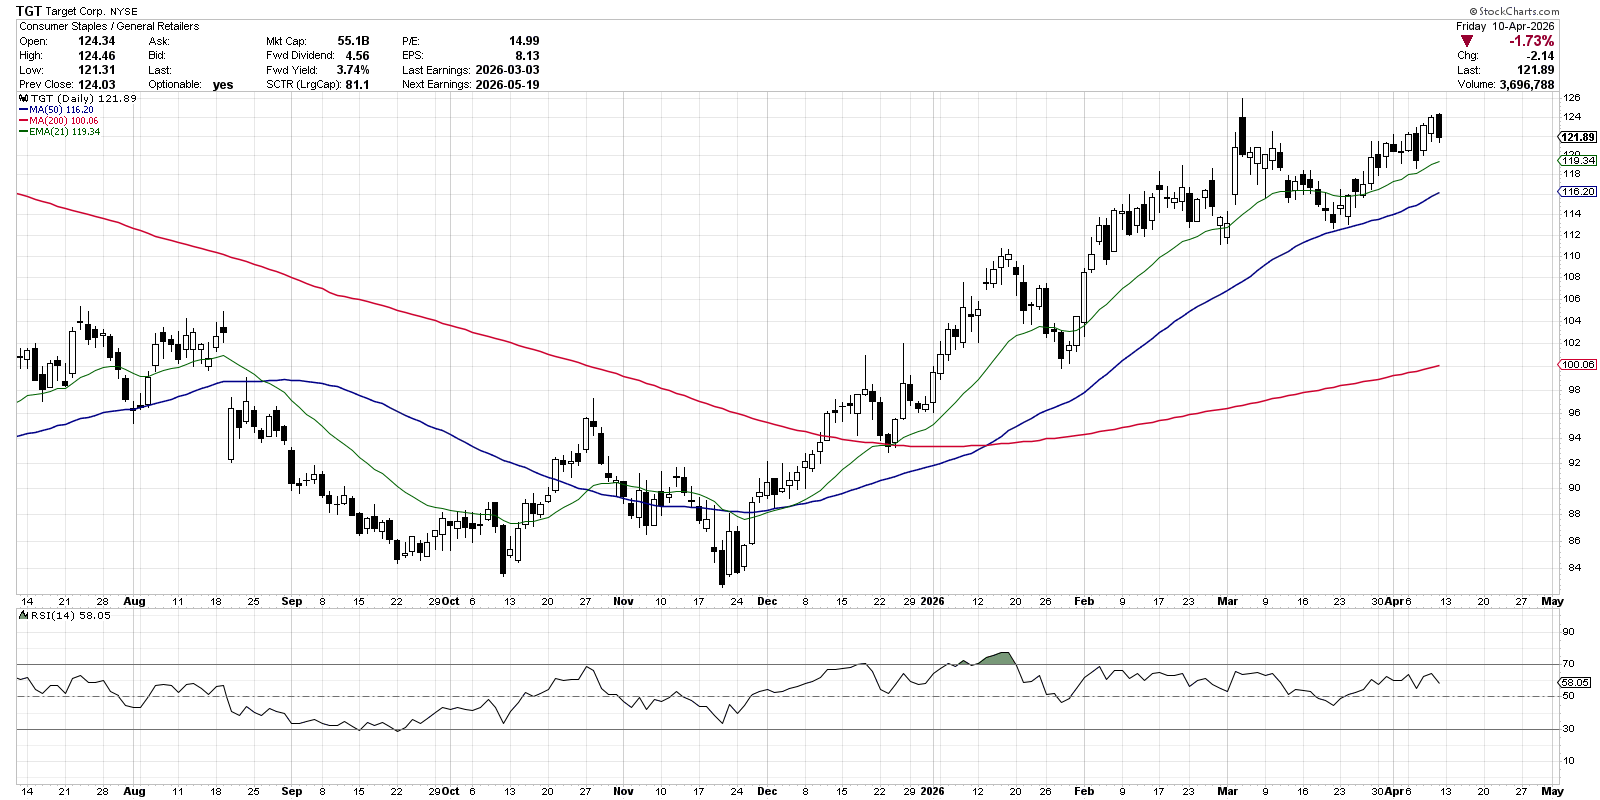
The bearish engulfing pattern is a fairly easy one to interpret when you think about the behavior of investors between the two days. A strong up move on day one indicates plenty of demand as traders push the stock up to close near the high of the session. The higher open on day two seems to provide an initial confirmation of that bullish behavior, but the lower close of day two instead shows a lack of willing buyers.
With this bearish candle pattern, as the price retests a previous peak, a downside reversal seems to make sense in the short-term. In this case, we’re watching the 21-day exponential moving average, as well as the 50-day simple moving average, as potential support levels if a downturn emerges next week.
TJX Cos. (TJX): The Bearish Harami Pattern
We’ve been following the strong uptrend phase in apparel names including Ross Stores (ROST) as well as TJX Cos. (TJX). Here we see another candle reversal pattern called the bearish harami. Similar to the bearish engulfing pattern, an up day followed by a down day indicates a short-term shift in sentiment from bullish to bearish.
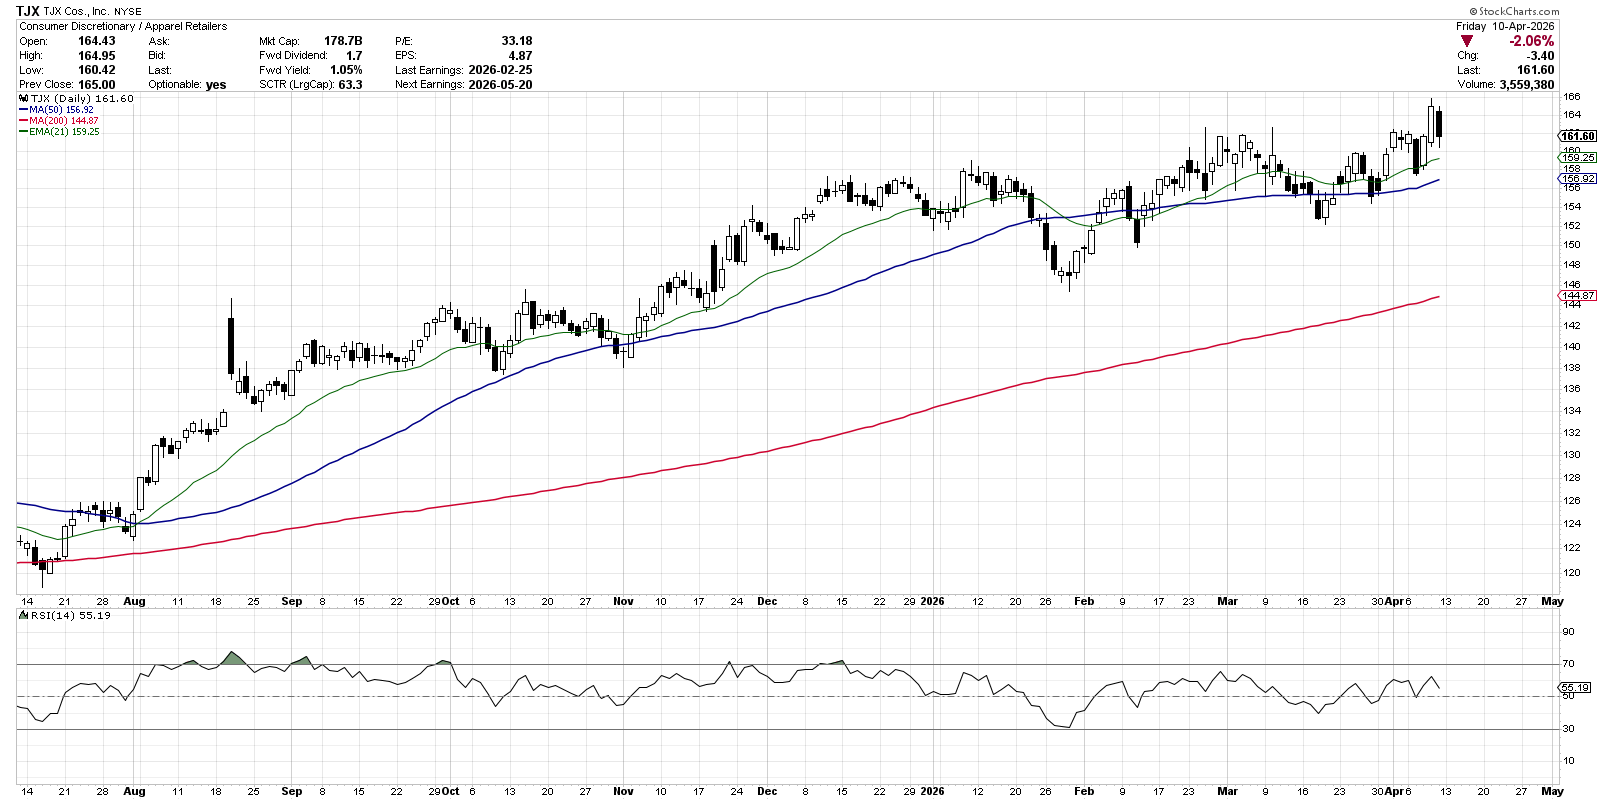
Thursday brought a new all-time high for TJX, finally breaking above resistance around $162. Then Friday’s session saw an open below Thursday’s close, and a close that rapidly approached Thursday’s opening price. Just like the bearish engulfing pattern, this two-day reversal pattern confirms a lack of willing buyers over the two days.
As long as TJX can push back above the previous breakout level of $162, we’re inclined to consider this stock as still in a valid uptrend phase. In fact, we would see a move down to the 50-day moving average as still resulting in a higher low and a confirmed uptrend. A break below the March swing low around $152, however, would mean a potential new downtrend phase, as evidenced by the lower low.
These three charts were featured as part of our Top 10 Charts to Watch for April 2026. For more information and a deeper analysis of these and seven other compelling charts, check out our weekly show on StockCharts TV!
RR#6,
Dave
P.S. Ready to upgrade your investment process? Check out my free behavioral investing course!
David Keller, CMT
President and Chief Strategist
Sierra Alpha Research LLC
marketmisbehavior.com
https://www.youtube.com/c/MarketMisbehavior
Disclaimer: This blog is for educational purposes only and should not be construed as financial advice. The ideas and strategies should never be used without first assessing your own personal and financial situation, or without consulting a financial professional.
The author does not have a position in mentioned securities at the time of publication. Any opinions expressed herein are solely those of the author and do not in any way represent the views or opinions of any other person or entity.