Can the Dow Reach 50,000? Breaking Down the Market’s Latest Rally

Key Takeaways
- The Dow Jones Industrial Average hits fresh record highs as blue-chip stocks lead a surprising late-year rally.
- Value and Financials outperform while tech giants like Microsoft and Apple eye the next big milestone.
- Investors watch Caterpillar, Goldman Sachs, and UnitedHealth for clues on whether 50,000 is within reach.
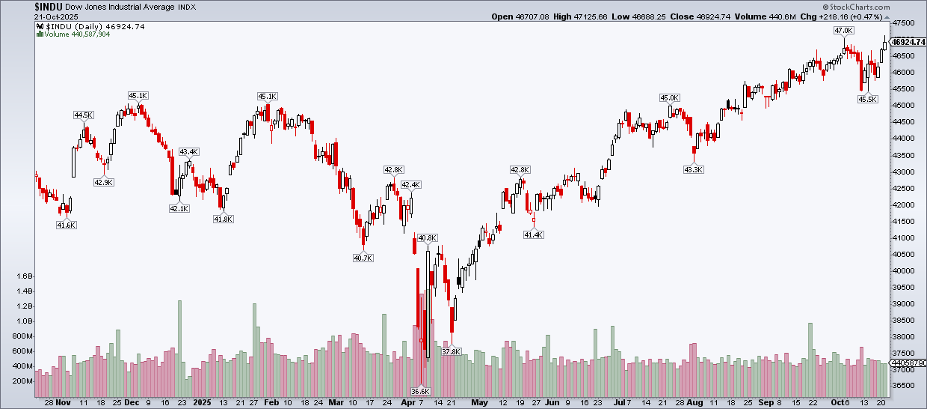
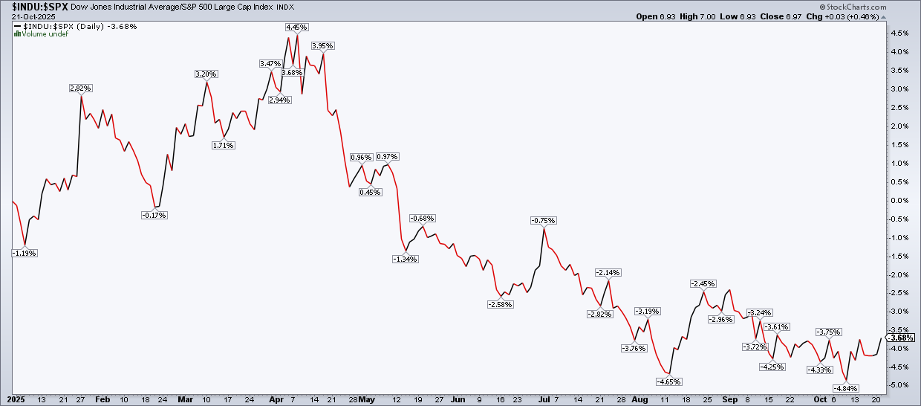
Don’t call it a comeback. The Dow Jones Industrial Average ($INDU) logged a record high on Tuesday, the only one of the major U.S. indexes to do so. The blue chips have performed well as the third-quarter earnings season steps into high gear. It’s easy to bypass the Financials-heavy, price-weighted DJIA, but it can offer interesting clues about market direction, depending on its absolute and relative strength.
A Closer Look at Market Leaders and Laggards
Let’s dig into what's working in the Dow and what’s lagging. There are some familiar themes and other, more under-the-surface trends that help us get a sense of how the end of the year will progress.
Visualizing Performance with StockCharts’ MarketCarpets
First, a chart tells a thousand words. StockCharts’ MarketCarpets are my go-to for a quick glance at what’s hot and what’s not over a given timeframe. What’s unique about StockCharts’ suite of performance heat maps is that you can weight them by price. For a cap-weighted index like the S&P 500, that’s fruitless, but with the DJIA, it’s ideal.
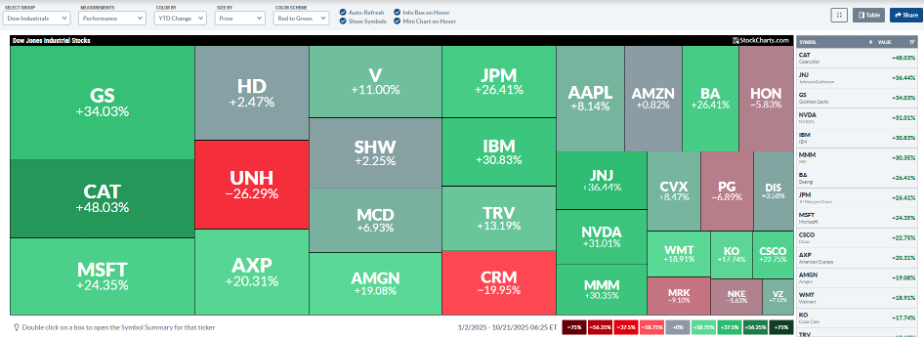
With the price size selected, we see that Goldman Sachs (GS) is the largest position, currently just shy of 10%. The bank, which reported standout earnings last week, ranks No. 3 in YTD performance, as seen on the far-right panel. The top dog is a CAT — Caterpillar, that is.
Caterpillar’s AI Twist and Technical Strength
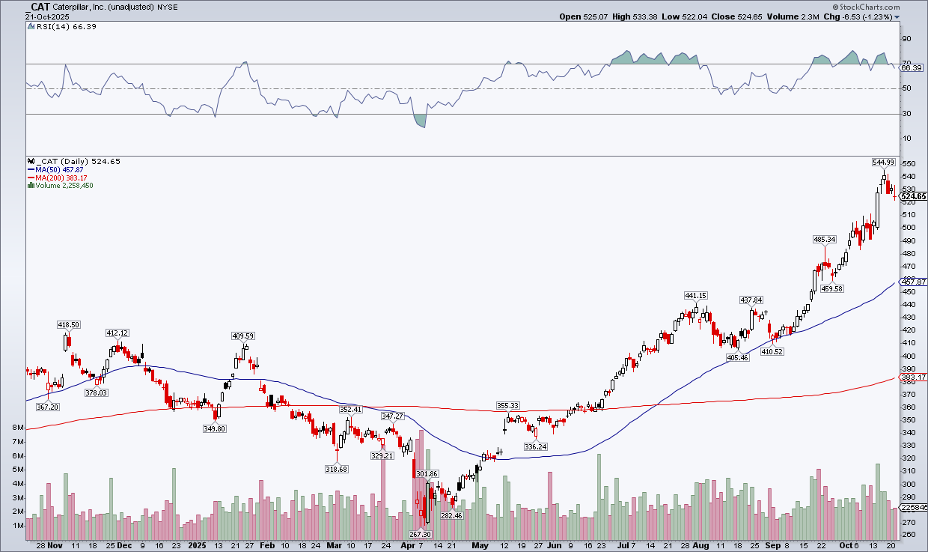
CAT posts Q3 results next Wednesday night, and shares have a chance of eclipsing a 50% gain on the year. The Texas-based, $246 billion market-cap Industrials-sector firm has become more of an AI play than a traditional U.S. cyclical bellwether. Demand for its power-generation turbines and other tech equipment has helped boost earnings growth expectations for out years.
Technically, CAT is working off oversold conditions. Its RSI momentum oscillator was above 70 from mid-September through last week. Shares are now stretched from their rising 50-day moving average, so a CAT nap in price action would be well-deserved and probably healthy for the stock.
Johnson & Johnson to New Highs
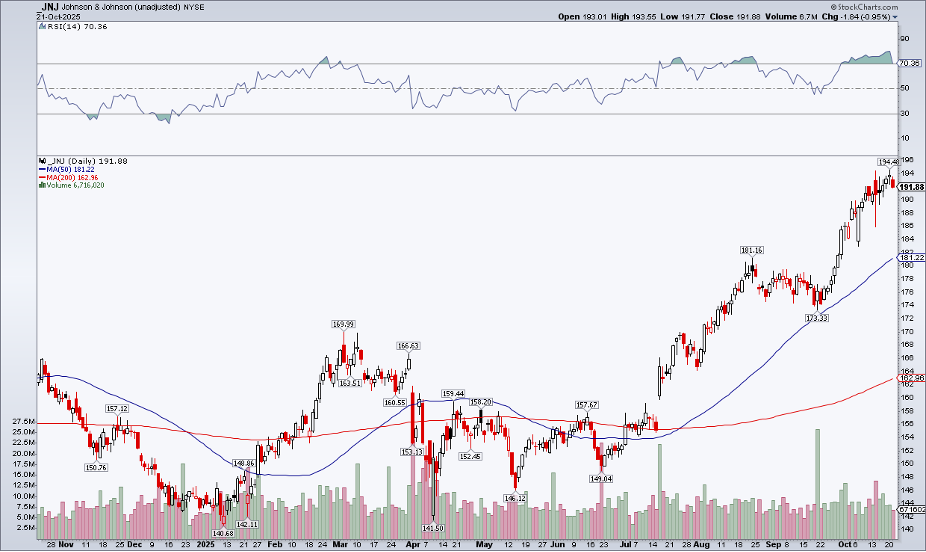
Quietly leading in the second half is something unrelated to the AI trade. Johnson & Johnson (JNJ) added 30% from late June to its all-time high logged earlier this week. Like Goldman, JNJ pleased the Street with its Q3 report, topping estimates and hiking guidance.
Dow vs. S&P 500: A Tale of Value and Growth
Bigger picture, the Dow is more value-oriented compared to the S&P 500. Fifty-five percent of the SPDR Dow Jones Industrial Average ETF (DIA) is classified as large-cap value, while the S&P 500 SPDR ETF (SPY) has just 22% exposure to the upper-left corner of the style box. Only 2% of the DJIA is large-cap growth.
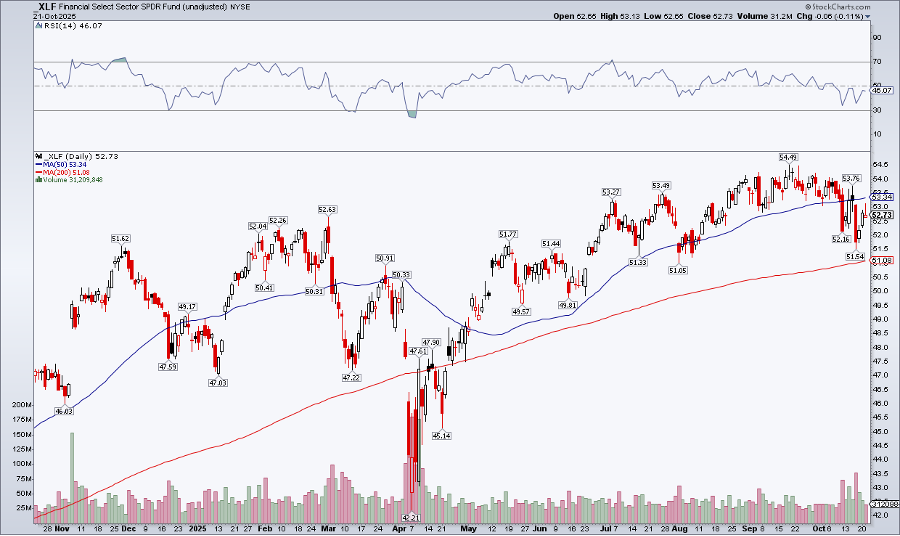
Perhaps the most telling difference is the sector makeup. DIA is 27% Financials and 21% Information Technology. The S&P 500 ETF? 36% I.T., 13% Financials. As it stands, the Financials Select Sector SPDR ETF (XLF) is in a precarious position. XLF is below its 50-day moving average and nearly kissed the rising 200-day moving average during last week’s cockroach regional banking kerfuffle. Its RSI momentum oscillator is now sub-50 after printing unimpressive levels as XLF bumped up against new highs in Q3. Overall, it’s not a great look.
Can the Mag 7 Push the Dow to 50,000?
But can big tech save the day and prompt a year-end push toward 50,000 for the century-old index? It might be a big ask.
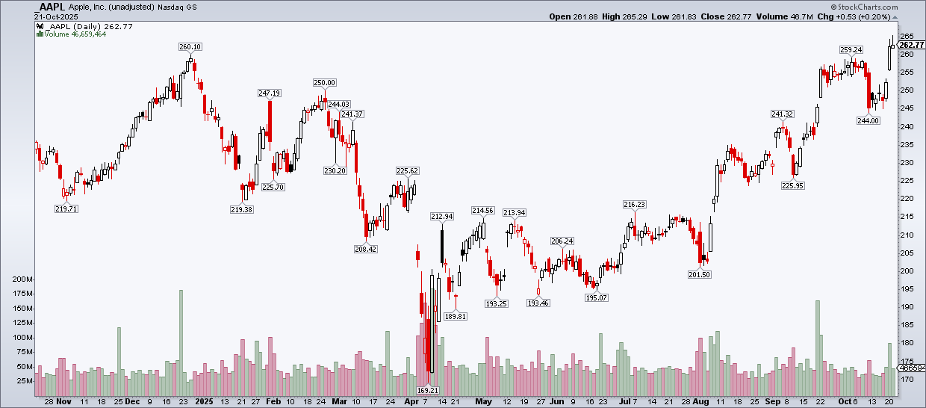
Now, with a pair of all-time high closes in 2025, Apple (AAPL) eyes the $4 trillion market-cap level and seeks to secure the No. 2 market-cap position behind NVIDIA (NVDA). While shares have rallied 30% since early August, Apple is but a small slice of the DJIA — just 3.4%. The price-weighting scheme strikes again.
Also plotting on the smaller, right-hand side are NVDA and Amazon (AMZN). But one of the Mag 7 has a chance to take the index named after Charles Dow and Edward Jones to the 50k round number: Microsoft (MSFT).
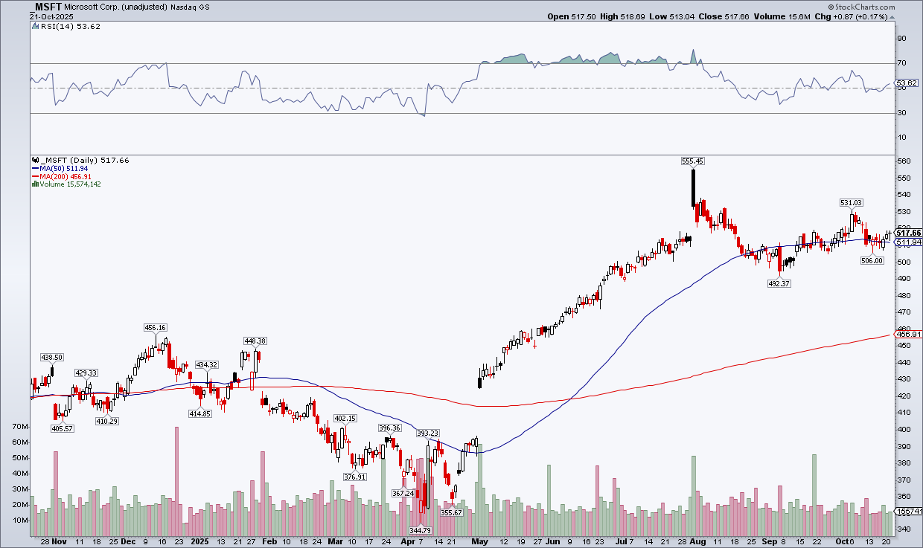
“Mr. Softy” has done a whole lot of nothing since its fiscal Q4 earnings report in late July. Shares spiked to $555 but now tread water in the low $500s. MSFT’s implied volatility is not all that high ahead of its October 29 first-quarter 2026 release — just 29%. The options market prices in a 4.4% move up or down after the report. Technically, the bearish marubozu candle back on July 31 looms large. In short, it’s hard to be excited about the third-largest DJIA stock.
A Surprise Leader Among the Dow Dogs
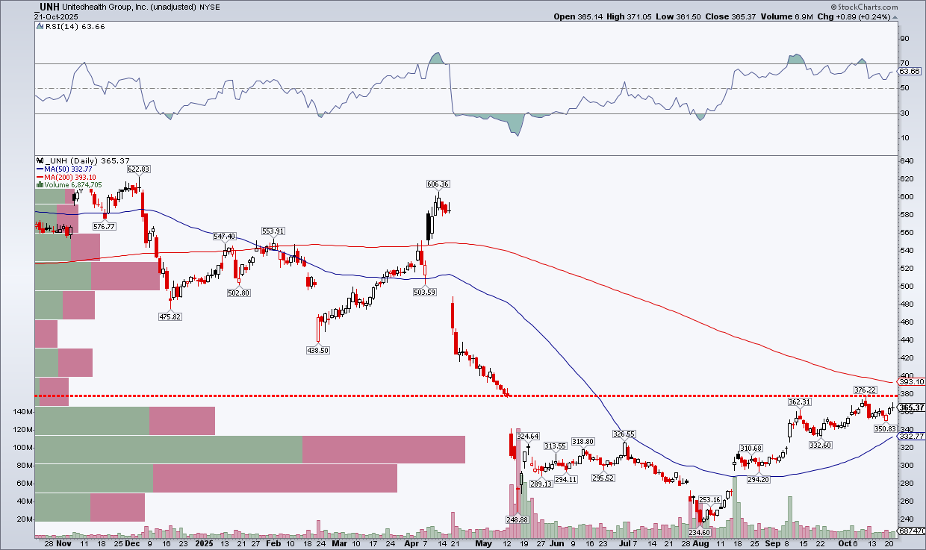
Maybe we have to venture to the dogs of the Dow to find a bullish, contrarian candidate that can lead a year-end charge. (Technically, Dow dogs are the top 10 index members by dividend yield.) Embattled UnitedHealth Group (UNH) is up more than 50% from its August nadir.
Vital signs have improved markedly, but now the fifth most important DJIA stock finds itself at a critical point — right at its May 13 gap. The 200-day moving average enters the scene at $393. A rally through those points would be a shot in the Dow’s arm. To its credit, UNH is the best of the 30 over the past three months, up 26%.
The Bottom Line
The Dow Jones Industrial Average lagged the S&P 500 off the April low, but the blue-chip index’s relative strength has improved since mid-August. When it hits records, the evening news and casual investing public take notice. Headlines would certainly be made if the Dow reached 50,000 in the months ahead. For it to do so, it requires leadership from its top components.
Disclaimer: This blog is for educational purposes only and should not be construed as financial advice. The ideas and strategies should never be used without first assessing your own personal and financial situation, or without consulting a financial professional.


