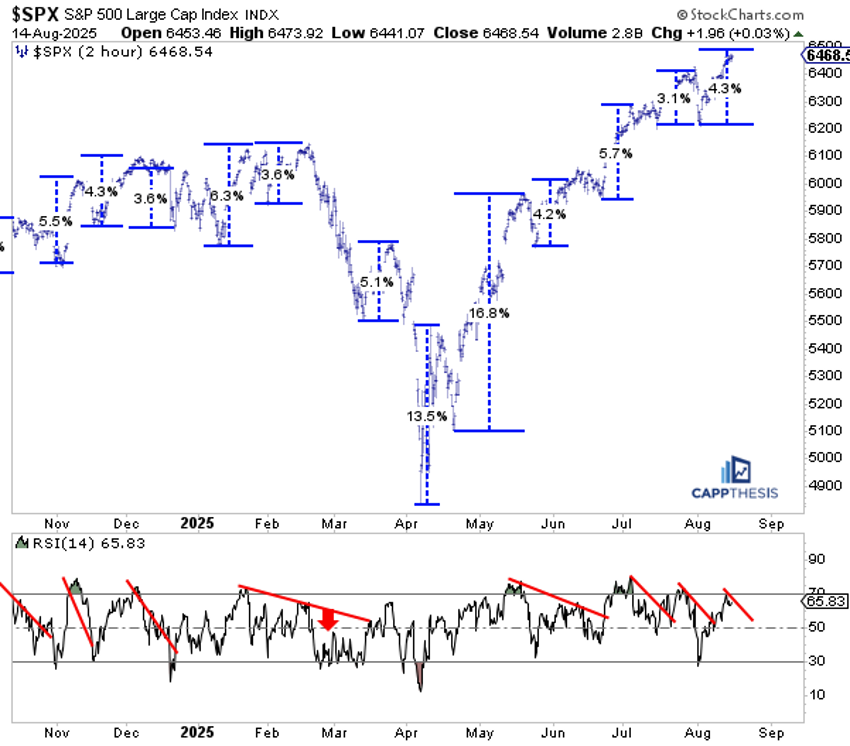
Short-Term Market Swings: A Gentle Rhythm of Short-Term Bounces

Through Thursday’s close, the S&P 500’s recent trough-to-peak advance has totaled 4.3%. Looking back to mid-May, this move lines up with the three prior short-term bounces, which ranged between 3.1% and 5.7%. On the two-hour chart, the most recent bounce pushed the 14-period Relative Strength Index (RSI) from oversold back to overbought.
This is the third time a short-term bounce has brought both an overbought condition and a new all-time high. This combination is one of the strongest short-term setups we could see. If this ebb-and-flow advance keeps going, this would be a natural spot to anticipate another pause. So far, such pauses have yet to develop into anything more substantial on the downside.
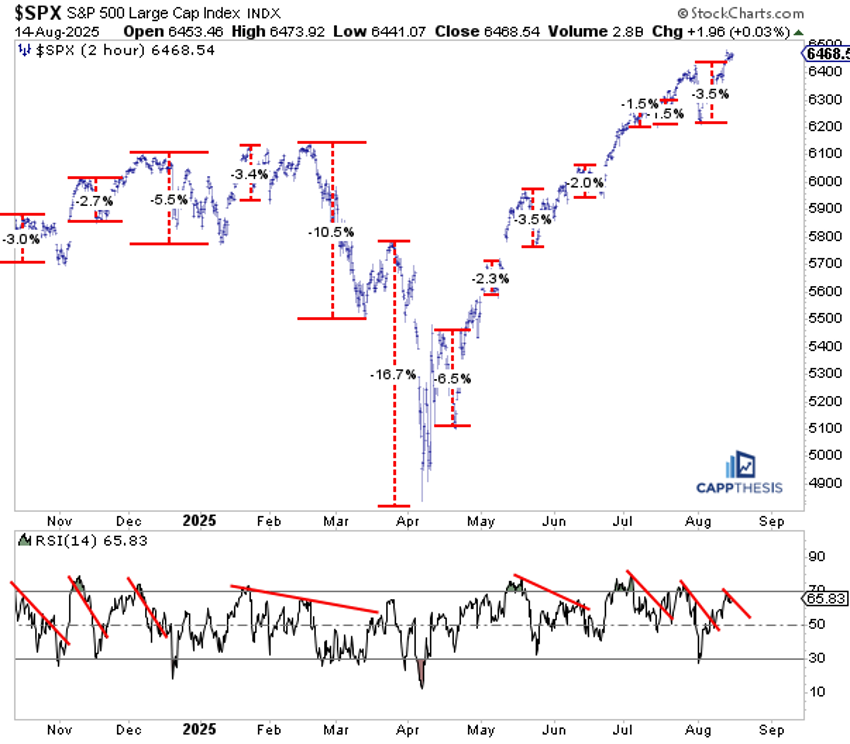
How Deep Was the Last Dip?
Looking at the stock market’s price action through a “drawdown” lens, the initial pullback was sharp after the S&P 500 hit its previous all-time high on July 28. However, the strong 1.8% decline on August 1 was as bad as it got, with a quick turn thereafter. In total, the entire drawdown was only 3.5%, which matches the same-size decline we saw in late May that gave way to a strong June and July.
At this point, we wouldn’t be surprised to see another bout of profit-taking at any time, but, with none of the potential bearish chart patterns playing out, it’s back to square one for the bears.
Market Breadth: More Stocks Up Than Down
Taking a closer look at the S&P 500’s market breadth, we’re coming off two straight 80% days (Tuesday and Wednesday), something we hadn’t seen since April 11-14. Back then, it was still the very beginning of the bounce that has now extended for four additional months.
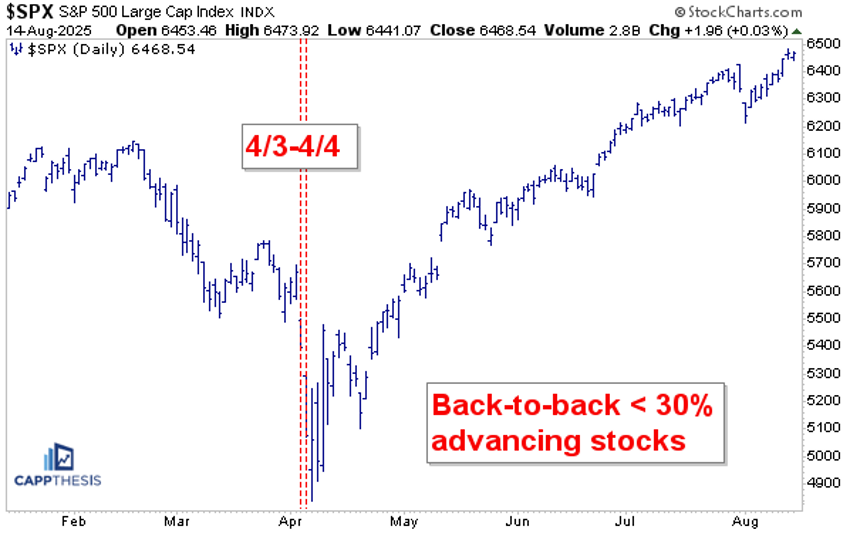
Thursday’s price action broke that streak, with sub-30% breadth, one of the lowest readings in recent months. One thing we haven’t seen since the worst part of April, though, has been back-to-back sub-30% sessions. That last occurred when the market was in the thick of the decline on Thursday, April 3, and Friday, April 4, when the S&P 500 had only 16% and 3% of stocks advancing respectively. Those two days came alongside steep declines of 4.8% and 6%, marking the worst stretch of that selloff before the historic pivot low the following week.
In other words, from a price action perspective, pattern perspective, and breadth perspective, there has been limited downside follow-through. Would a second straight sub-30% day signal that the market’s character has changed? No, but it would suggest the foundation could be shifting. This, along with other factors, will be worth watching for potential signs of a trend shift, which, so far, hasn’t been the case.
Another Negative Divergence — Should We Worry?
With the S&P 500 making new all-time highs this week, its 14-day RSI has continued to bounce after hitting 50 at the start of the month. As of last night’s close, RSI stood at 68, not yet overbought.
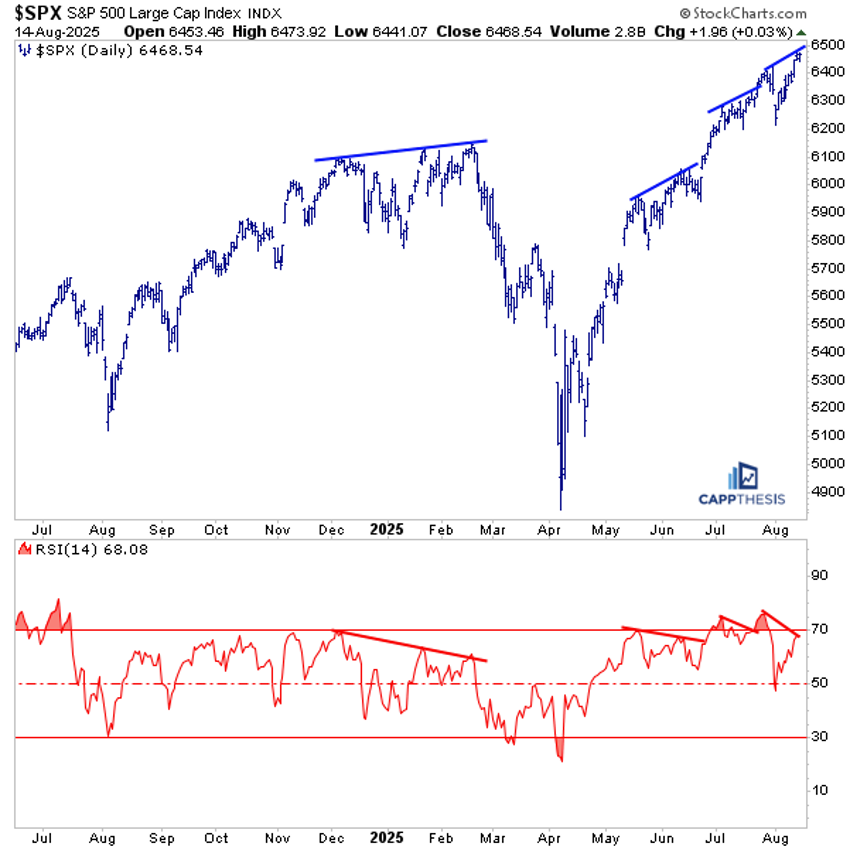
This is getting a lot of attention, especially from the bears, who point to a distinct negative momentum divergence. That’s true, but let’s not forget we’ve seen two prior negative divergences just like this one, with the S&P making a higher high while the indicator lagged. Both times, the lagging RSI was only temporary, and eventually caught up to the index, making a new high, and reaching overbought once again.
Until proven otherwise, this looks like it could be a repeat of that pattern. Of course, every time is different and there are no guarantees. If this divergence leads to a bigger pullback, we should be ready for the next set of bearish patterns to take shape.
The Bottom Line
The S&P 500's short-term rhythm has been consistent: rise, pause, rise again. Breadth has been generally healthy, and even the negative divergence between the index and RSI hasn't derailed the uptrend.
Could we see a pause or a pullback? We could, but, so far, the market has been quick to bounce back.


