A “Change of Character” for Stocks: Key Breakdown Levels to Watch
There’s no doubt we’ve observed a “change of character” in the major equity indexes in November. And despite Friday’s resounding up close with strong breadth, the broader message of weaker price action with weaker momentum still stands out.
Here are two concerning breakdowns we’ve observed so far this month, which speak to deteriorating market conditions going into next week. We’ll also analyze the most important breakdown that hasn’t triggered yet, but could hit as early as next week.
Newer Dow Theory Breakdown Confirms Weaker Conditions
Charles Dow’s foundational work of comparing equity indexes to gauge the strength of the economy still resonates in 2025. Instead of the Dow Industrials and Dow Transports, however, I prefer to use what I call a “Newer Dow Theory” approach. Here, we’re showing the Invesco S&P 500 Equal Weight ETF (RSP) and Direxion Nasdaq-100 Equal Weighted Index (QQQE).
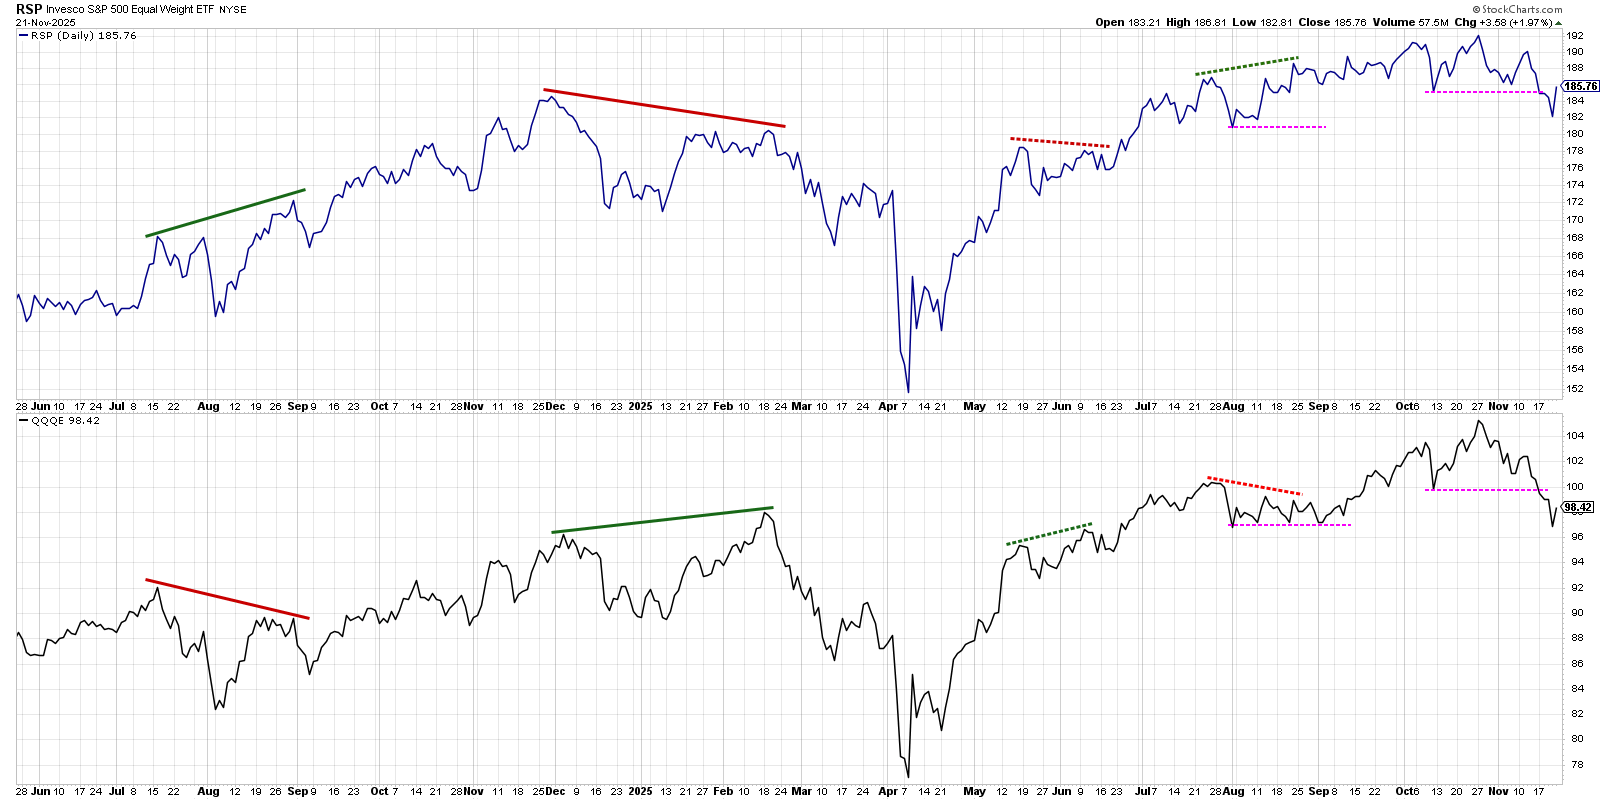
When both of these ETFs achieved new all-time highs in October, that confirmed a bullish market phase. This week, however, we noted that both ETFs broke below their swing lows from mid-October. Both indexes breaking down suggests a “bear confirmed” configuration and implies further downside in store for US equities.
Until and unless both the S&P 500 and Nasdaq 100 make a new swing high, or one ETF makes a new swing low that is not confirmed by the other ETF, this chart will remain in a bearish configuration.
Bitcoin Breakdown Suggests Slippery Slope of Speculation
On a recent episode of the Market Misbehavior podcast, technical analyst Andrew Thrasher, CMT discussed how Bitcoin can provide an excellent view into speculative pressures in the marketplace. With limited fundamental data to support Bitcoin and other cryptocurrencies, their price movements can be attributed more to investor psychology as market participants make decisions based on fear and greed.
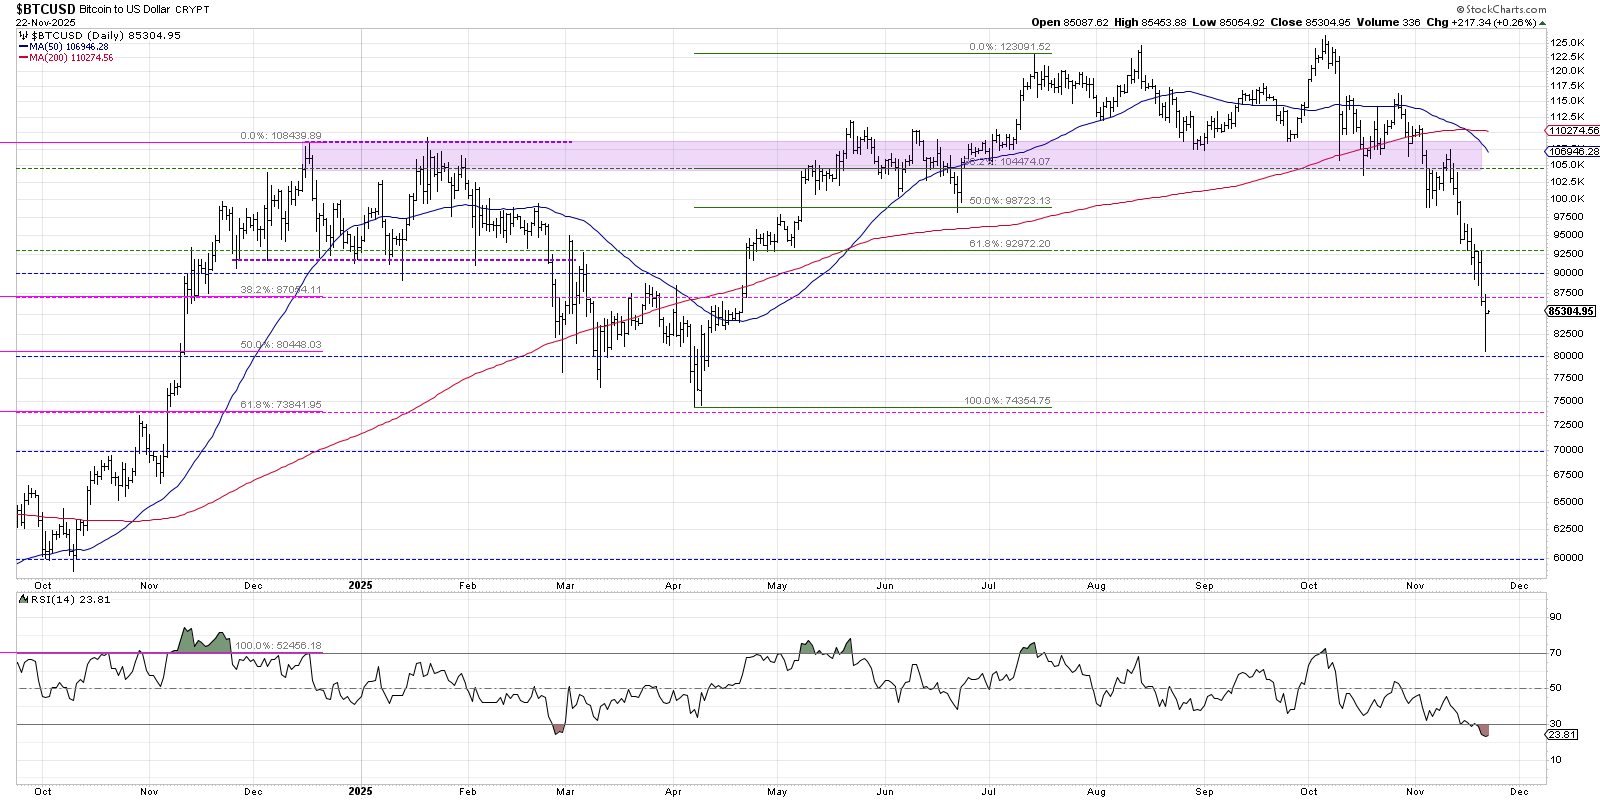
While the S&P 500 and Nasdaq 100 were making new all-time highs in late October, the chart of Bitcoin had already broken below its 50-day moving average. In subsequent weeks, Bitcoin failed to hold its 200-day moving average and also broke below a key Fibonacci support level around $105K.
With Bitcoin now below a 61.8% retracement level, we would expect a meaningful low in the $75-80K range. That would line up fairly well with major lows in March and April 2025, and would cause us to be on the lookout for bullish momentum divergences.
So while the chart of Bitcoin could be near a significant area of support, the breakdown from $125K in October to almost $80K in November shows how we have transitioned from a euphoric uptrend phase to a waterfall decline breaking all the support. Bitcoin could end up being one of the most effective leading indicators of 2025!
S&P 500 Breakdown Would Complete the Bearish Picture
Even though measures of momentum and breadth have flashed clear signs of deterioration in Q4, the chart of the S&P 500 has remained in a fairly constructive pattern. An uptrend is a pattern of higher highs and higher lows, and the price of the S&P 500 has demonstrated this uptrend pattern ever since the April market low.
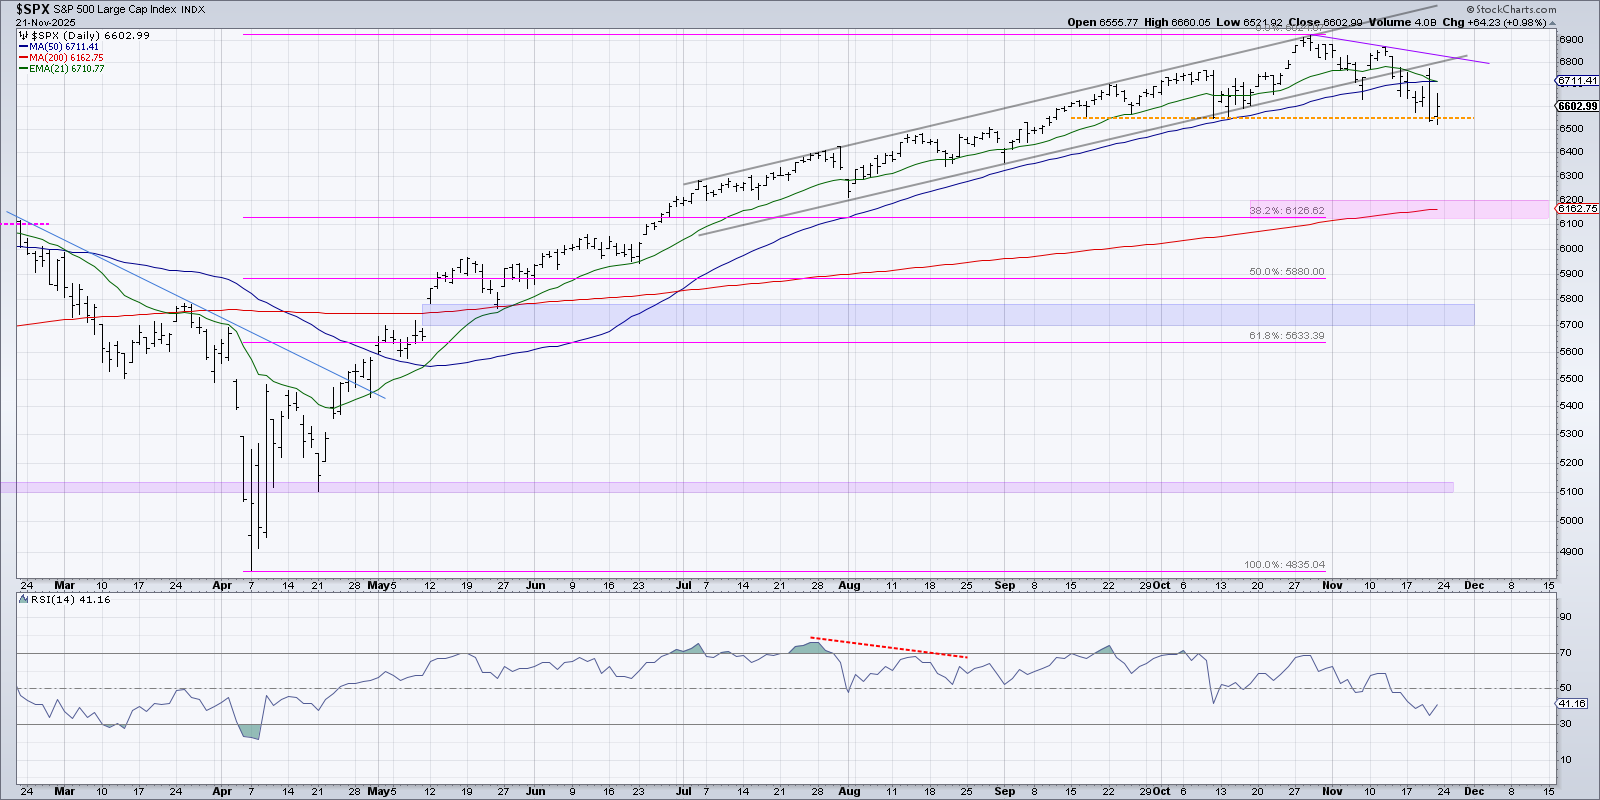
Thursday’s drop after Nvidia’s earnings report pulled the SPX down to test our “line in the sand” around 6550, a level we’ve covered often on our daily market recap show. Friday’s bounce higher served to confirm yet again the importance of this major support level for the S&P.
If the S&P 500 confirms a valid breakdown below 6550, and if that drop is fueled by the RSI pushing further below the 40 level, that would suggest a more significant and likely drawn-out distribution phase. We’d favor an initial downside target around 6120-6200, based on a 38.2% retracement of the April to October bull phase. The 200-day moving average currently sits right in the middle of the potential support zone, lending further validation to this downside price objective.
RR#6,
Dave
P.S. Ready to upgrade your investment process? Check out my free behavioral investing course!
David Keller, CMT
President and Chief Strategist
Sierra Alpha Research
marketmisbehavior.com
https://www.youtube.com/c/MarketMisbehavior
Disclaimer: This blog is for educational purposes only and should not be construed as financial advice. The ideas and strategies should never be used without first assessing your own personal and financial situation, or without consulting a financial professional.
The author does not have a position in mentioned securities at the time of publication. Any opinions expressed herein are solely those of the author and do not in any way represent the views or opinions of any other person or entity.


