From Slump to Surge: Why Investors Are Smiling Again

Key Takeaways
- The stock market bounced back strongly after Powell's speech.
- Strength was broad-based, with small-cap stocks, homebuilders, and banks joining the rally.
- Key indexes bounced off support levels, momentum indicators are improving, and even bonds and precious metals are catching a bid.
Wall Street had plenty to celebrate on Friday morning after hearing Federal Reserve Chairman Jerome Powell’s speech. His comments gave investors more confidence that interest rate cuts may be a reality in its September meeting, and that was enough to bring buyers back in a big way. The stock market came roaring back, ending the week in the green.
The Dow Industrials ($INDU) closed at a record high, while the S&P 500 ($SPX) came within a hair of its record. The index is now where it was before the selloff.
The Nasdaq Composite ($COMPQ), which had been weighted down by worries about an “AI bubble” and news that some AI projects aren’t living up to the hype, came back strong, jumping almost 2% on Friday. When big-name tech stocks are the top market movers on the upside, it tends to lift the whole market’s mood, which is just what happened.
Strength Across the Board
It wasn’t only big tech names pushing things higher. Ten of the 11 S&P 500 sectors closed in the green, with Consumer Discretionary taking the top spot. More importantly, the overall stock market is showing signs of strength, with many indexes trading above their 20-day exponential moving average (EMA). Market breadth is also improving.
In hindsight, the recent dip looks more like a healthy pause than anything to panic about. If you regularly monitor your charts, you may have noticed that the recent selloff did not show signs of panic.
Zooming in on Tech Stocks (QQQ)
Let’s take a closer look at the daily chart of the Invesco QQQ Trust (QQQ), an ETF that has a good representation of the large-cap tech stocks. Midweek, QQQ slipped below its 21-day EMA, which can be a warning sign. Looking back at the price action on August 1, though, the same thing happened, and QQQ quickly bounced back to new highs.
This time, we didn’t see a one-day reversal. Instead, we had another day of selling, although Thursday’s price action was a relatively narrow range where the open and close weren’t too far apart – a signal that hesitancy was in the air.
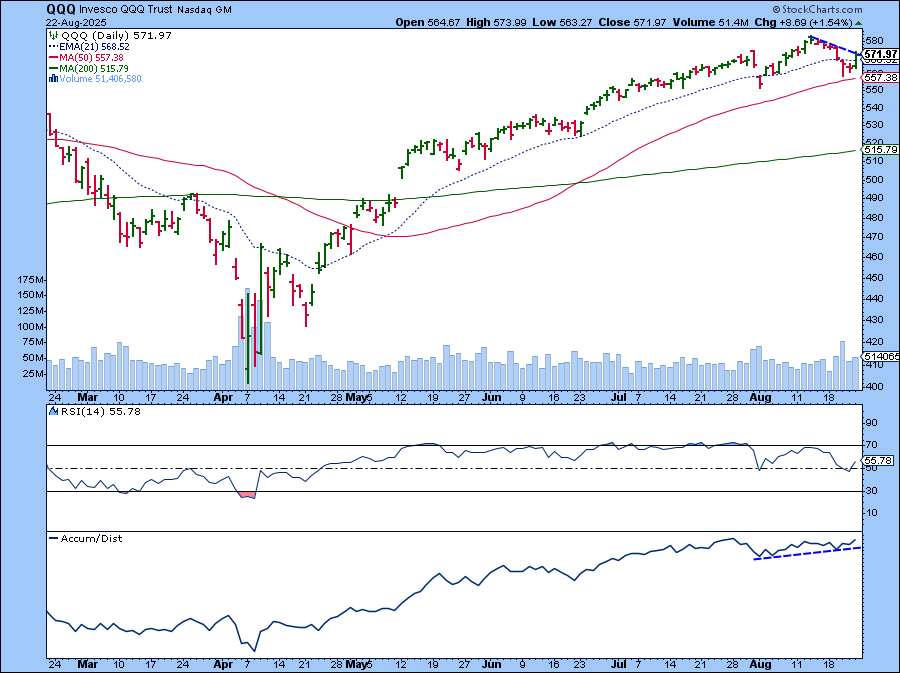
Friday’s price action brought the ETF back above its 21-day EMA. The Relative Strength Index (RSI) fell slightly below 50, but recovered and is now moving higher, similar to what it did during the August 1 selloff.
The Accumulation/Distribution Line (bottom panel) was in a slight uptrend even when the QQQ was selling off, suggesting that buying pressure was still strong.
One thing to watch: QQQ is now testing the downward trendline from the August 13 high. A break above this trendline would confirm the bullish trajectory of the ETF.
Don’t Overlook the Small-Caps
It wasn’t just tech stocks that were leading the charge in the broader indexes. Smaller companies, which often react more strongly to changes in interest rates, had a strong showing too.
The chart of the iShares Russell 2000 ETF (IWM) reflects the move in small-cap stocks.
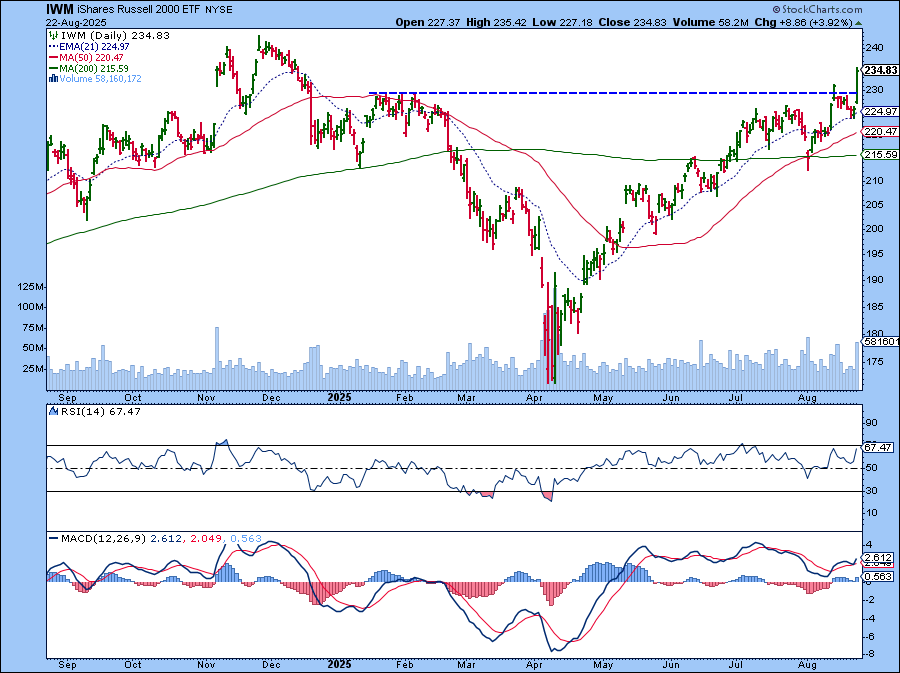
Note how the ETF held bounced off its 21-day EMA on Thursday, while the three major indexes were selling off. The RSI remained above 50, and the Moving Average Convergence/Divergence (MACD) also held up in positive territory, with the MACD line remaining above the Signal line and slightly sloping higher.
IWM broke above the resistance of its August 13–August 19 resistance level, which coincides with its early 2025 resistance level (blue dashed line). An upside move in small-cap stocks supports the overall bullish equity rally in the market.
Interest rate-sensitive asset groups, such as homebuilders and regional banks, saw explosive moves on Friday. Pull up the chart of SPDR S&P Homebuilders ETF (XHB) and SPDR S&P Regional Banking ETF (KRE), and you'll see their moves are similar to what you see in the chart of IWM.
Bonds, Precious Metals, US Dollar
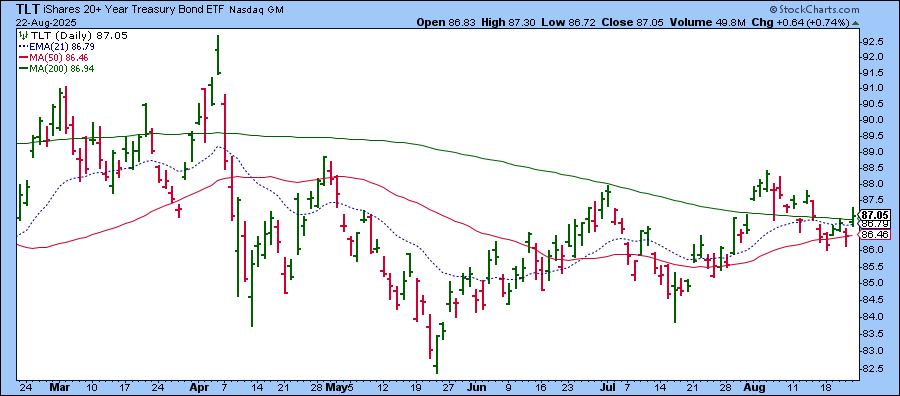
With September rate cut odds rising to around 83% (it was just shy of 70% early Friday morning), it’s no surprise that bond yields fell. Bond prices, which move opposite to yields, rose slightly. The chart of the iShares 20+ Year Treasury Bond ETF (TLT) is worth monitoring. Although Friday’s rise was slight, the overall pattern since the May low is a slightly upward-sloping trend with higher highs and higher lows.
Precious metals like silver and gold also got a lift, as did cryptocurrencies. Silver is especially interesting since it’s edging close to its 52-week high. Meanwhile, the U.S. dollar slipped, which usually happens when investors expect lower interest rates.
What’s Next?
The week ahead looks quieter in terms of scheduled events, but there are two big items on the calendar. Firstly, chip giant NVIDIA (NVDA) reports earnings on Wednesday after the close. This is a must-watch given how much tech stocks move the market. Then, on Friday, we’ll get the July Personal Consumption Expenditure (PCE) report, one of the Fed’s favorite inflation gauges.
Next week could turn out to be another eventful one for the markets. Stay tuned!

End-of-Week Wrap-Up
Stock Market Weekly Performance
- Dow Jones Industrial Average: 45,631.74 (+1.53%)
- S&P 500: 6,455.91 (+0.27)
- Nasdaq Composite: 21,496 (-0.58%)
- $VIX: 14.24 (-5.63%)
- Best performing sector for the week: Energy
- Worst performing sector for the week: Technology
- Top 5 Large Cap SCTR stocks: MP Materials Corp (MP); Astera Labs, Inc. (ASAR); Robinhood Markets Inc. (HOOD); Nebulous Group NV (NBIS); Celsius Holdings, Inc. (CELH)
On Our Radar Next Week
- July Durable Goods Orders
- July PCE
- Several Fed speeches
Disclaimer: This blog is for educational purposes only and should not be construed as financial advice. The ideas and strategies should never be used without first assessing your own personal and financial situation, or without consulting a financial professional.


