August’s Market Mood: Small Caps, Rate-Sensitive Stocks, and the Story Behind Market Breadth

Key Takeaways
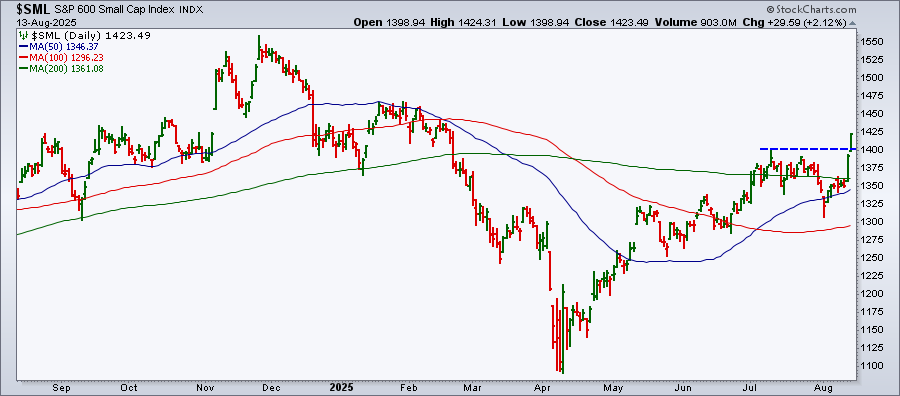
- The S&P 600 Small Cap Index surged above its 200-day moving average, hinting at a healthier broader market.
- Homebuilders, biotech, retail, and transportation are all gaining momentum.
- The NYSE McClellan Summation Index hasn't confirmed the latest rally yet. Track it on StockCharts to stay ahead of potential momentum shifts.
We’re almost halfway through August and, so far, the stock market is looking sunny. On Wednesday, the S&P 500 ($SPX) and Nasdaq Composite ($COMPQ) notched fresh all-time highs, and the Dow Jones Industrial Average ($INDU) isn’t far behind. Even the small-cap stocks are gaining confidence, with the S&P 600 Small Cap Index ($SML) jumping 2.12% higher.
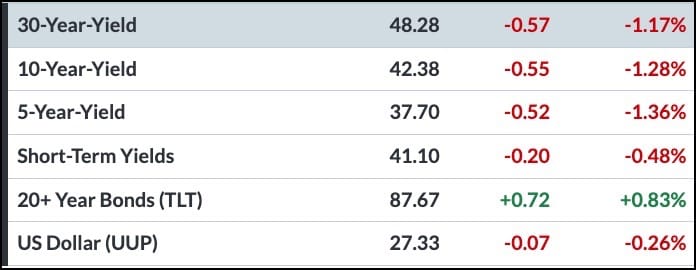
Over in the alternative asset world, Bitcoin hit a new record, bond prices rose, and volatility stayed comfortably low. “Risk on” sentiment is still very much alive!
Why the Optimism?
Tuesday’s CPI numbers gave investors something to smile about. Long-term Treasury yields (especially the 10- and 30-year) have been drifting lower, and the odds of a Fed rate cut in September have shot up to over 90%.
The shift in sentiment boosted small-cap stocks and sparked rallies in homebuilders, biotech, retail, Consumer Discretionary, and banks. When these sectors see strength, it’s often a sign of a healthy economy.
Broader Market Participation
Earlier this month, the S&P 600 dipped below its 50-day moving average on August 1, which raised alarm bells. But the index recovered and, on Tuesday, surged 3.23%, followed by another 2.12% rise on Wednesday. The index is now trading above its 200-day moving average and above its July 10 high of 1400.
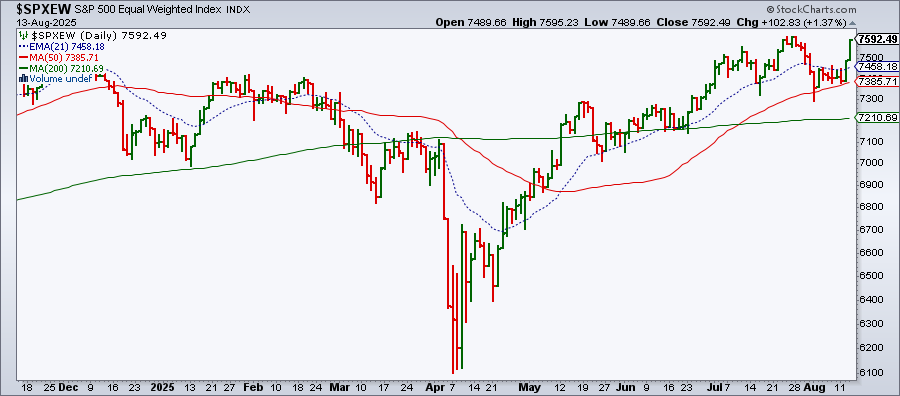
Even the S&P 500 Equal Weight Index ($SPXEW) got in on the action. This is an indication that the market’s heavyweights, the Mag 7 stocks, might be catching their breath, letting the rest of the pack play catch-up.
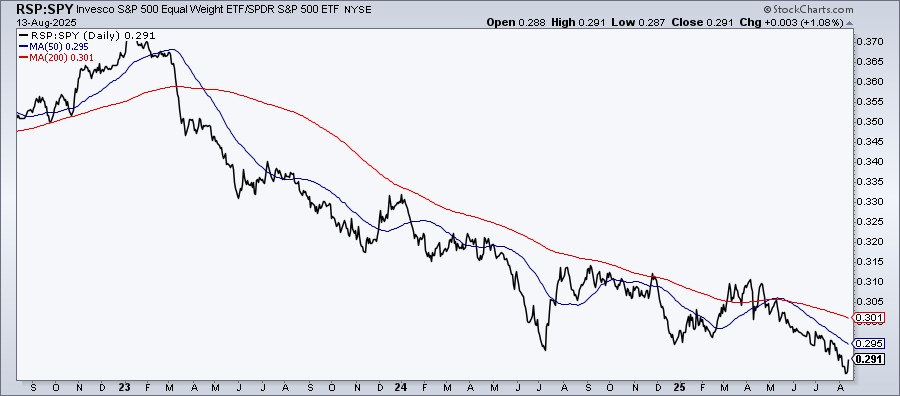
If you compare the Invesco S&P 500 Equal Weight ETF (RSP) to the SPDR S&P 500 ETF (SPY), it’s clear that RSP has been lagging SPY since 2023. RSP still has a long way to go before confirming broader market participation, but we are starting to see those first green shoots. The big question now is whether they’ll grow into tall trees or wither away.
Which Groups Stand Out?
A quick glance at the US Industries panel in the Market Summary page shows homebuilders, retail, and transportation leading the charge. The Key Ratios panel shows that investors are leaning into offense, favoring Consumer Discretionary, Biotech, and Hotels over their defensive counterparts.
Switch to the Size tab in the Key Ratios panel and you’ll see another interesting twist. Wednesday’s data shows mega-caps are underperforming large-caps, while mid-, small-, and micro-caps are outperforming large-caps. If this trend holds, it could be a healthy move for the stock market.
A Word of Caution: Watch the NYSI
It’s easy to get swept up in the market euphoria, but seasoned investors and traders know how to peek under the hood. One indicator worth watching is the NYSE McClellan Summation Index ($NYSI). Since July, $NYSI has been trending lower, even as the NYSE Composite Index ($NYA) pushed higher.
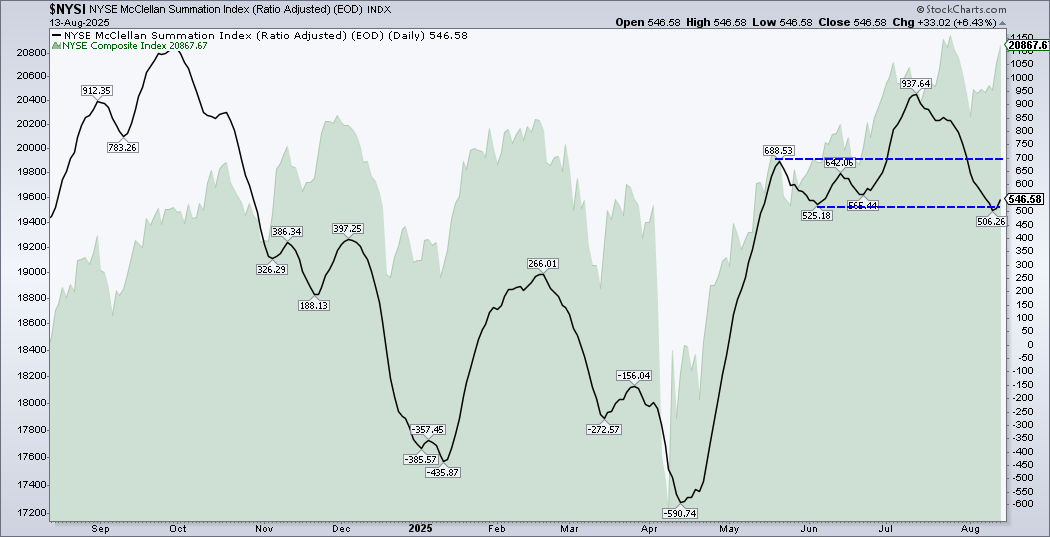
While the NYSE has been rising since August 4, $NYSI hasn’t confirmed the bullish move. It’s still sitting below its May 20 high of 688.53 and its June 4 low of 525.18. If the NYSE moves higher and breaks above 688.53, it would strengthen the bullish case. Until then, it’s a “keep it on your radar” situation, not a reason to panic.
Markets are complex. Your tools shouldn’t be. Explore the StockCharts Market Indicators.
The Bottom Line
The market is in an optimistic mood, mainly due to fully pricing in a Fed rate cut in September. Small-caps and other groups are gaining momentum, which points to broader market participation. While this is encouraging, it’s also a time to be alert. So, keep your charts handy and track the indicators that reveal what’s happening beneath the surface.
If you’re not already using tools such as the StockCharts Market Summary and market breadth indicators, now’s the time to add them to your toolkit.


