Gold and Silver Shine While Stocks Slip: How to Position Your Portfolio

Key Takeaways
- SLV pushed to its highest level since 2011, while GLD closed at a record high.
- Despite the selloff, the uptrend in the broader stock market indexes is intact.
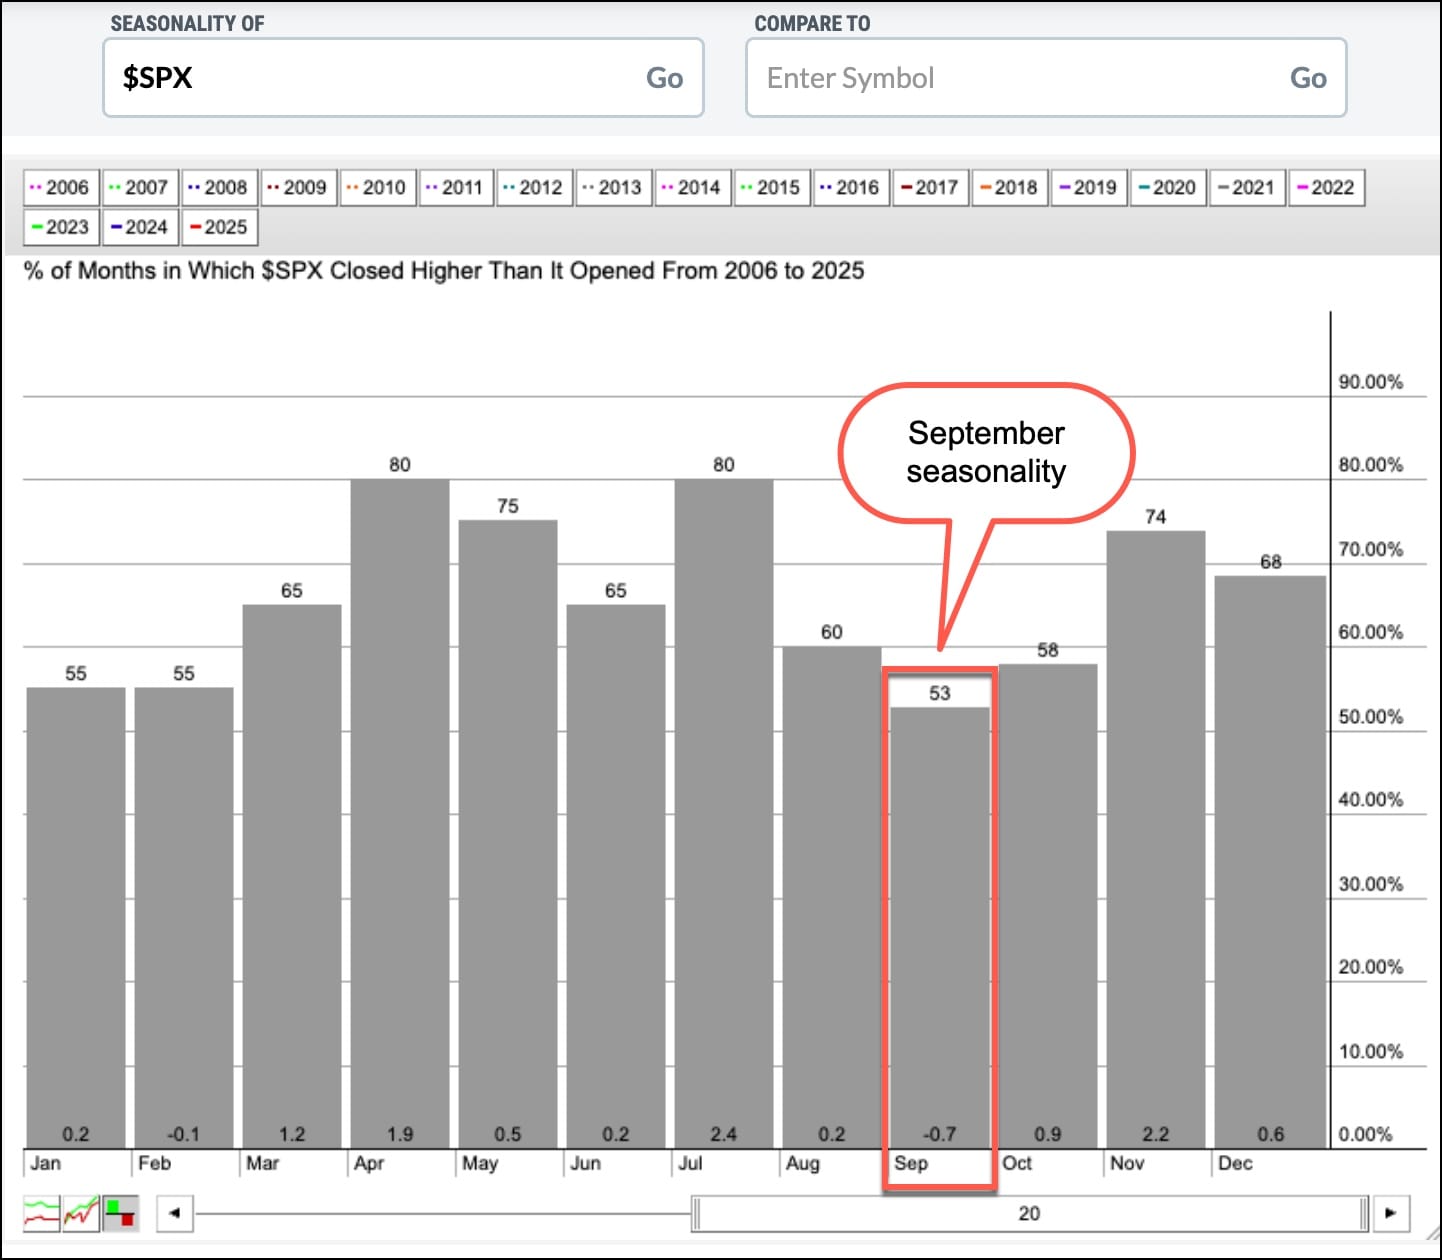
- Seasonally, September is choppier (up ~53% of the time with a modest average decline), so keep an eye on the rotation.
It was a little bumpy on Friday. Stocks sold off on the last trading day of August, but there was a whole lot of buzzing in the precious metals world, especially silver. Silver futures finally pushed through the $40/oz mark, a level that’s been tough to clear this year. Gold futures were hovering near their all-time highs. With July’s PCE inflation reading coming in line with expectations, the odds of a Fed rate cut in September remain above 85%. This backdrop often favors precious metals.
Silver Stands Out
The iShares Silver Trust (SLV) closed at $36.19, a level we haven’t seen since 2011. On the daily chart below, you can see some sharp moves in the ETF. SLV has been in a classic “range to breakout to run” pattern. In May, SLV was trading sideways; it broke out, surged, and paused in June; and then it drifted through mid-July to the end of August, before breaking out again and moving sharply higher.

After peaking on July 23, SLV pulled back to its 50-day simple moving average (SMA), bounced off it, and rallied, but not as sharply as on previous occasions. SLV has now gapped higher again. Historically, these gaps have often led to sharp follow-through moves, where we could see if there’s enough momentum behind the move.
What to watch
- The July 23 high as the first support level for SLV.
- The 21-day exponential moving average (EMA).
- The 50-day SMA as a “line in the sand” for trend health.
Gold’s Spectacular Run (But It’s Testing a Ceiling)
Gold prices have rallied strongly this year. The SPDR Gold Shares (GLD) closed at a new high and is bumping up against a resistance area (blue dashed line). A breakout above this level would open the door to new highs.

Both metals are trading above their 21-day EMA and, since April, have outperformed the S&P 500.

Gold and silver have experienced a notable rally this year, with gold rising over 30% and silver rising over 37%. One reason for the metals’ strength is the softer U.S. dollar. If the dollar firms up, expect gold and silver to cool off a bit.
Are Investors Going “Risk-Off”?
While the broader stock market indexes are selling off, the bullish trend is still intact. There may be some rotation out of the Mag 7 stocks, but overall, the uptrend in the broader indexes is still in play.
Remember, we’re entering a tricky month. September tends to be seasonally weaker for equities. Perhaps investors are taking profits ahead of the Labor Day weekend.
The Seasonality Chart of the S&P 500 shows that over the last 20 years, in September, the index has an average return of -0.70% and 53% of the time, it closed higher. So, September isn’t always a negative return month for the S&P 500, but it can be choppy.

Looking Ahead
As we head into September, here are a few things you should monitor.
- The U.S. dollar. It’s making a slow and steady move higher, but an explosive move could put some pressure on metals.
- Bond yields. As long as bond yields remain stable, equities are likely to remain bullish. A rapid move higher could be a headwind.
- September chop. If necessary, trim your oversized winners; there’s no need to “panic sell” if the uptrend is still intact.
- Watch for sector rotation. Leadership can shift even if the overall trend is up, so consider gaining exposure in some undervalued sectors.

End-of-Week Wrap-Up
Stock Market Weekly Performance
- Dow Jones Industrial Average: 45,544.88 (-0.19%)
- S&P 500: 6,460.26 (-0.10)
- Nasdaq Composite: 21,455.55 (-0.19%)
- $VIX: 15.39 (+8.30%)
- Best performing sector for the week: Energy
- Worst performing sector for the week: Consumer Staples
- Top 5 Large Cap SCTR stocks: MP Materials Corp (MP); Astera Labs, Inc. (ALAB); Rocket Lab USA, Inc. (RKLB); Nebius Group NV (NBIS); Credo Technology Group Holdings, Ltd. (CRDO)
On Our Radar Next Week
- August ISM Manufacturing PMI
- July JOLTs Report
- July Balance of Trade
- August ISM Services PMI
- August Non-Farm Payrolls (NFP)
- Several Fed speeches
Disclaimer: This blog is for educational purposes only and should not be construed as financial advice. The ideas and strategies should never be used without first assessing your own personal and financial situation, or without consulting a financial professional.


