What to Make of the Small-Cap Rally: A Closer Look at IJR and IWM

Key Takeaways
- The market’s bullish response to the July CPI report included big outperformance from small caps.
- The S&P Small Cap 600 ETF had its best day since May, along with its highest single-session alpha since the election.
- Here are the key indicators to watch and why small caps remain a show-me story.
Small caps stunned investors after Tuesday’s July CPI report. Now, two primary ETFs track the space.
The most well-known (perhaps “infamous” is the word) is the iShares Russell 2000 ETF (IWM), which is roughly 40% comprised of negative-earning companies. The other is the iShares Core S&P Small-Cap ETF (IJR), which features a profitability screen. The latter is viewed as higher quality, so it’s commonly preferred by factor investors hoping to benefit from the (very) long-term tendency for small caps to post alpha to large caps.
Zooming in on this past Tuesday, both IWM and IJR boasted the often-bullish upside “gap and go” chart pattern. It’s a colloquial term describing when a security opens significantly higher, then trends up throughout the session. In such events, bulls rule the day, and capitulation by the shorts occurs. Maybe that played out after the July inflation report.
IJR's Bullish Move
IJR soared 3.2% on CPI Day, small caps’ best session since May 12. The rally was notable in that it coincided with IJR jumping above its 200-day moving average, and the gap-and-go pattern resulted in a bullish marubozu candlestick pattern. Technicians are fast to rebut, noting that candles hold water only if they are confirmed by subsequent price action; IJR traded higher on the morning of Wednesday, the 13th. So, this rally may have some legs.
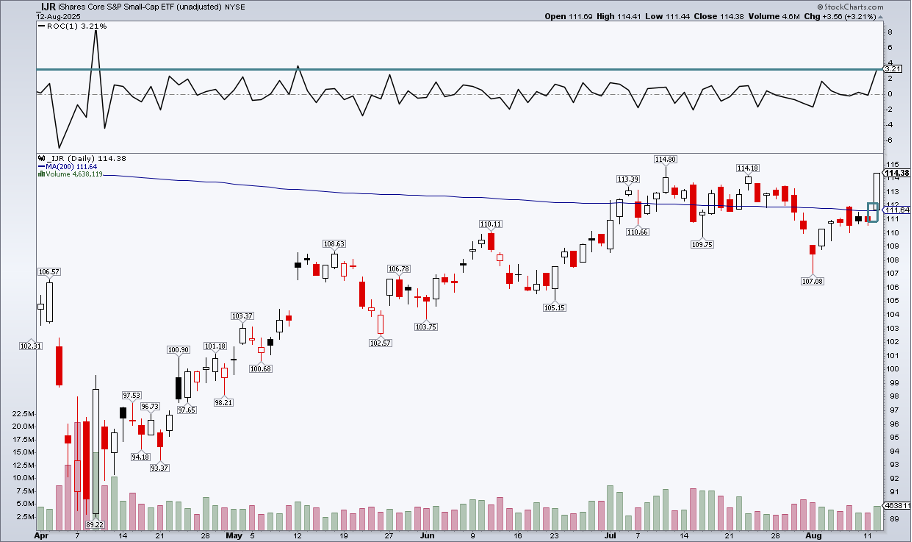
Still, I’d like to see IJR rally through its July peak on a closing basis. But even if that plays out, there’s overhead supply up to the all-time high of $128.61 notched in November 2024. Thus, the onus remains on small-cap bulls here.
IJR vs. SPY
That said, those bulls can pull up a chart of IJR’s relative strength. Tuesday’s 3.2% advance was a material 2.1 percentage points of outperformance to the S&P 500 ETF (SPY). That alpha boost was the largest since the day after the election. Stretch the chart out several years and you’ll see that such snapbacks are common. IJR peaked compared to the S&P 500 in early 2021, amid the peak of the stimulus-fueled euphoria and near the meme-stock mania’s zenith.
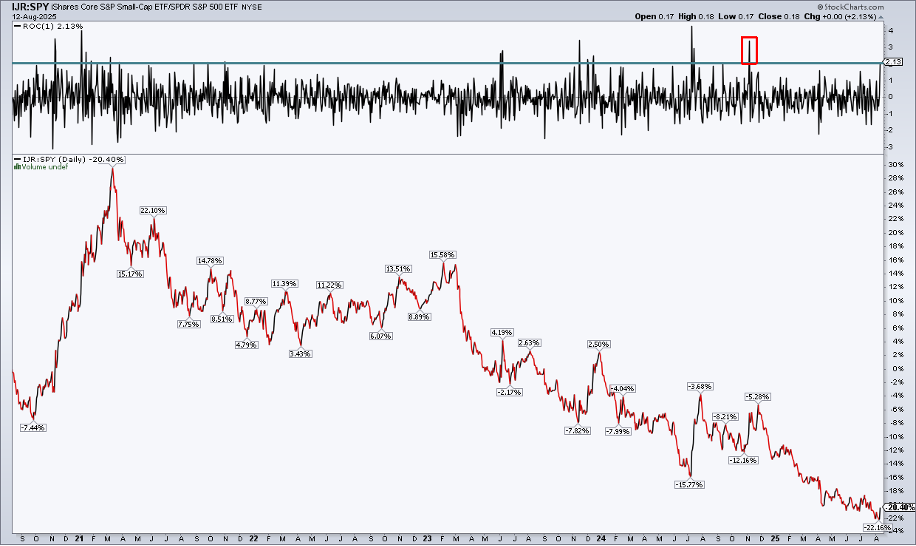
In fact, IJR:SPY remains very close to its lows dating back to the early 2000s. As a small-cap investor myself, it’s easy to get excited about these bullish bursts, but they tend to be mere relief rallies. Needless to say, I am skeptical that this is the beginning of a protracted uptrend in IJR’s absolute and relative price action.
IJR vs. IWM
Shifting gears a bit, I’d like to call out a partly false narrative that’s pervasive in the financial blogosphere. For years now, the “quality” trade has been in vogue. It’s a compelling storyline that owning shares of profitable companies with strong balance sheets and sustainable free cash flow growth beats betting on their lower-quality, often higher-beta, peers.
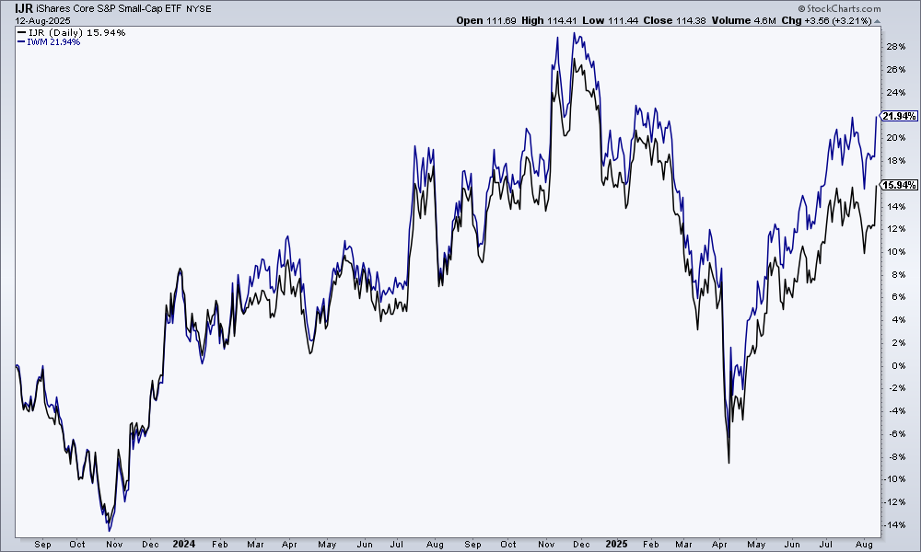
It has worked with many styles and sizes, but not so much within US small caps specifically. Notice in the performance chart below that IJR, a higher-quality small-cap play, has lost marginal ground to the junkier IWM. The gap, 22% versus 16% over the past two years, won’t make or break a portfolio, but it’s clear that common market maxims have not unfolded as you might think on the size front.
At the macro level, this week’s market vibes clearly point to expectations (no longer just hopes) for a September Fed rate cut. We’ve seen rate-sensitive plays like Homebuilders (XHB) and Regional Banks (KRE) work in recent weeks. If we are going down the path of easing monetary policy, then traders should eye high-beta trades within small caps.
For small caps to work, the economy needs to avoid a prolonged slowdown. Odds of a technical recession are muted, but a stretch of, say, three or four quarters of sub-2% real GDP growth with sticky inflation may not be conducive to IJR or IWM alpha.
The good news is that IJR’s earnings multiple is 17.7x, almost five times cheaper than the S&P 500’s P/E. BofA noted earlier this week that small caps have finally emerged from their earnings recession. Profits inflecting positive, coupled with a valuation discount and Fed rate cuts, is not a bad combination.
IJR's Seasonal Trends
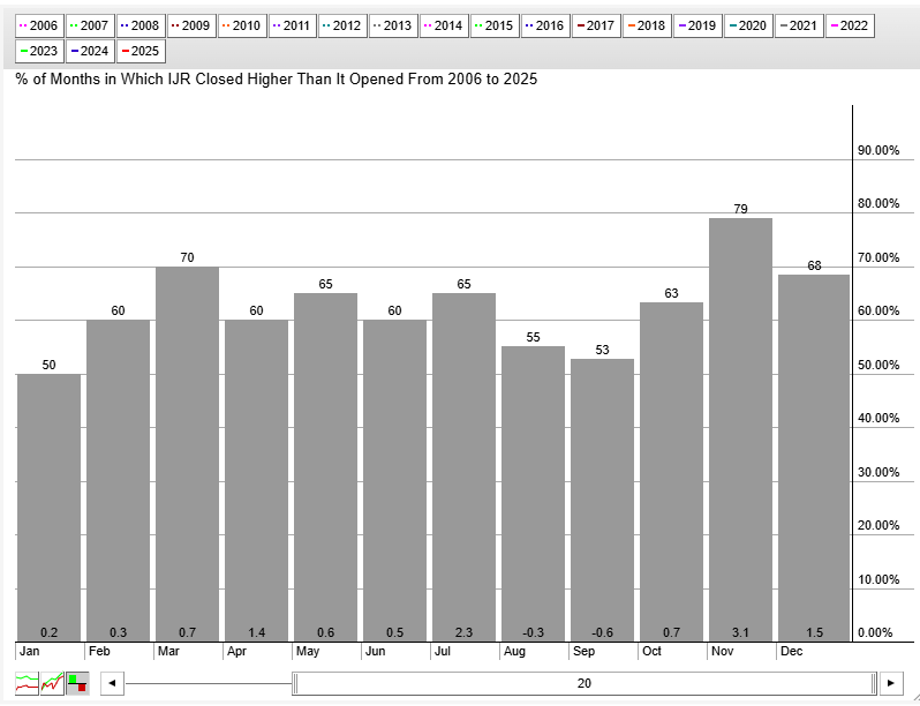
Finally, I must give a nod to weak seasonal trends. Since 2006, IJR has posted negative returns in both August and September, with monthly positivity rates no better than 55%.
The Bottom Line
Was the small-cap response to July CPI the spark of a real rally? Some indicators suggest so, but others are less bullish. My take? IJR and IWM are show-me stories in the near term.


