Mortgage Rates Hit 11-Month Low as Homebuilder Stocks Surge

Key Takeaways
- Ahead of a busy week of macro data, high-momentum housing stocks are put to the test.
- The average 30-year mortgage rate has dropped to levels not seen since October 2024, supporting bullish moves in homebuilders.
- One key macro x-factor that bears watching into year-end.
The S&P 500 ($SPX) eschewed weak August seasonality, rallying 1.9% during a month marked by strength in value sectors, drama surrounding the Fed, and robust corporate earnings. According to StockCharts’ seasonality charts, the S&P 500 averaged a precisely flat August return spanning 2005 to 2024, so momentum is solid right now.
S&P 500 Up a Fourth-Straight Month
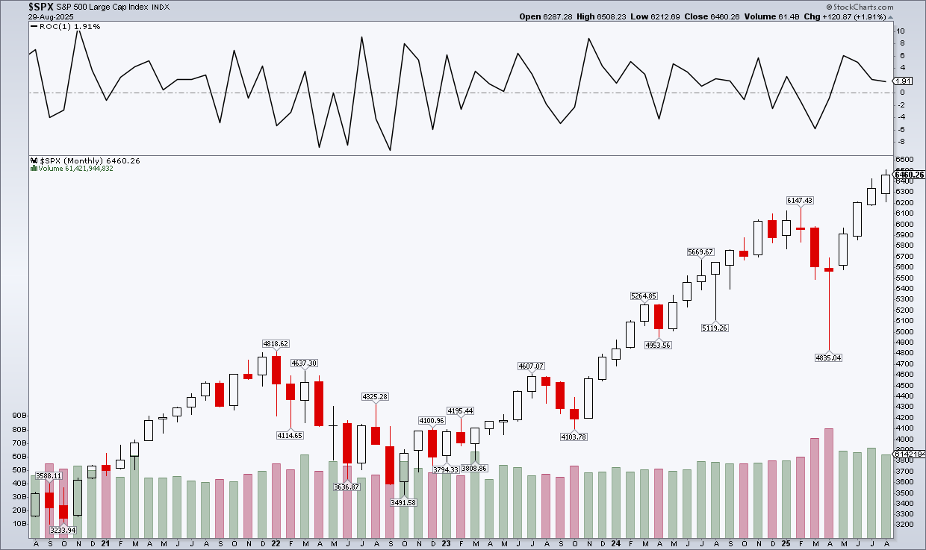
The real test might just be getting started. September is notoriously the weakest month on the calendar, but stocks enter the final month of the third quarter on their front foot. The S&P 500 rose above 6500 for the first time on the penultimate trading session of August, ahead of a big week of macro data.
Tuesday’s volatility catalysts could come in the form of manufacturing PMI data from both S&P Global and the ISM. Wednesday’s JOLTS report and a look at the Fed’s Beige Book of regional economic activity provide further color on business trends. To me, though, the real action begins on Thursday, when a slew of reports are set to cross the wires.
First, Challenger Job Cuts, which has only recently come into the spotlight, prints at 7:30 a.m. ET. Forty-five minutes later, the ADP Private Payrolls survey hits the tape (it usually publishes on the Wednesday before the official nonfarm payrolls report; the holiday-shortened week compresses the timeline). Initial and Continuing Claims follow at their usual time, along with a final read on Q2 nonfarm productivity. More PMI numbers come after the market’s open; this time, they're of the services sector. The busy day concludes with Fed speak in the afternoon and evening: the NY Fed’s Williams (leans hawkish) and Chicago Fed President Goolsbee (leans dovish) after the close.
Friday’s nonfarm payrolls report is the main event. A 75,000 headline jobs gain for August is the consensus expectation, with the unemployment rate ticking up to 4.3% from an unrounded 4.248% in July. All eyes will be on the June–July revisions, after 258,000 positions were erased in last month’s NFP.
Congress also returns from its August recess, which adds drama to price action. The Senate may move to confirm Stephen Miran to the Federal Open Market Committee, replacing former governor Adriana Kugler. And then there’s the ongoing case of Fed governor Cook, who is accused of committing mortgage fraud. Dr. Cook has vowed not to resign, and I’ll leave others to speculate on that situation.
So, there are plenty of reasons for trepidation amid so many macro crosscurrents. For consumers, one data point is actually encouraging compared to recent history: mortgage rates.
30-Year Mortgage Rate Trending Down in 2025, Still Elevated vs. 5 Years Ago
Traders and chartists may know StockCharts’ user-friendly view of price trends, but did you know you can graph economic data too? I enjoy plotting housing stocks against the 30-year mortgage rate. With the Fed expected to resume easing, the 30-year fixed mortgage rate should be on your radar.
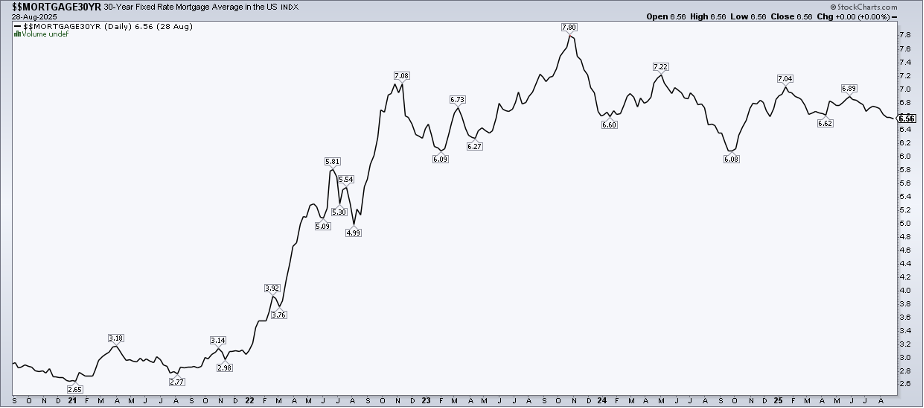
At 6.56%, it’s the lowest since last October. The 30-year mortgage rate is priced off the 10-year Treasury yield with a spread. Historically, the gap averages about two percentage points, meaning a 4% 10-year yield should equate to a 6% mortgage rate. The spread ballooned to more than 320 basis points from late 2022 through mid-2023, when rate volatility was at its peak. Recall, too, that the US regional banking turmoil played out in March 2023.
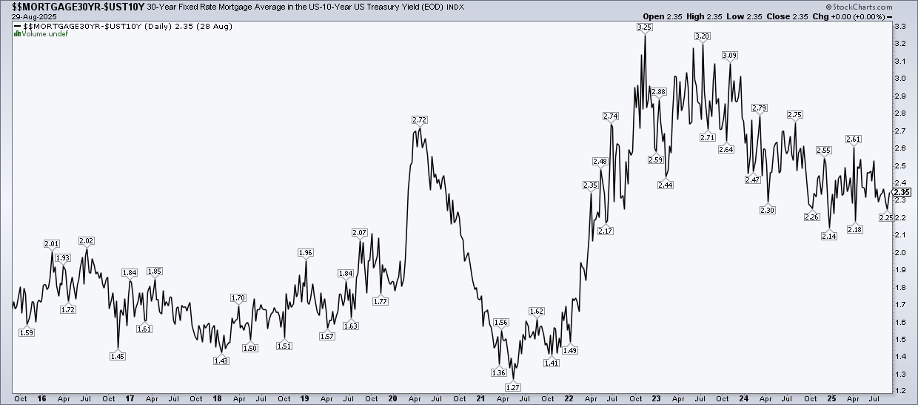
30-Year Mortgage Rate Minus the 10-Year Treasury Yield: Down 90 Basis Points from the Cycle High
I’m going to toss another macro indicator (and chart) at you now: the ICE MOVE Index. It’s like the VIX of the Treasury market. The MOVE Index is only now retreating to levels seen in early 2022, before the Fed began lifting its policy rate.
For a little Options 101, when volatility is high, options generally carry more value. Current mortgage borrowers effectively own a put option — if interest rates fall, they can put their mortgage back to the issuer and take out a new one. That optionality, along with other variables that we won’t geek out over, has kept upward pressure on the MOVE Index.
ICE MOVE Index: Near the Lowest Since Early 2022
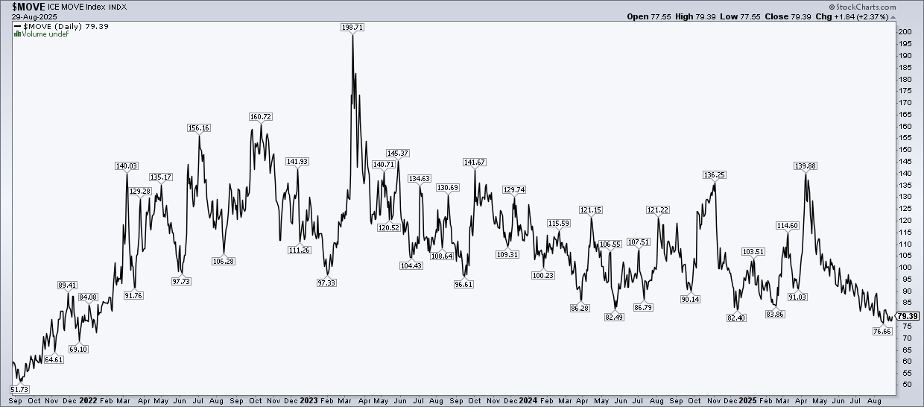
As the effective average US mortgage rate creeps closer to the 10-year yield, the MOVE Index should drift lower. Of course, anything could happen, and another mini crisis in Treasurys can’t be ruled out. For now, though, mortgage rates with a 5-handle in the coming months are possible.
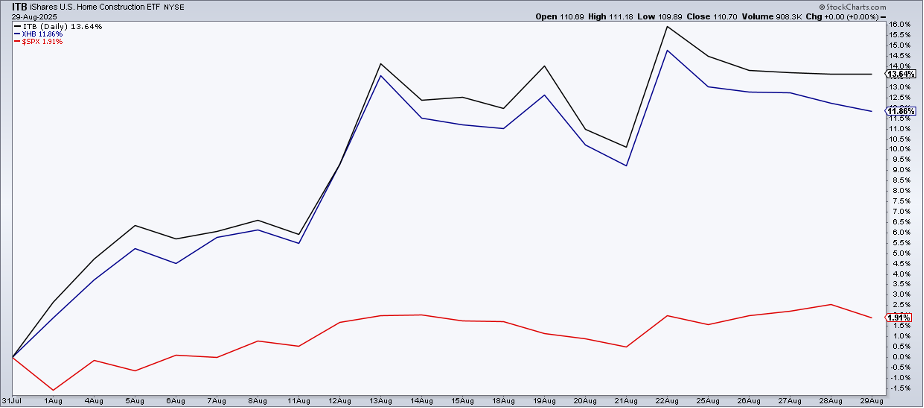
Homebuilder stocks may already be sniffing that out. Both the iShares US Home Construction ETF (ITB) and the SPDR S&P Homebuilders ETF (XHB) trounced housing bears last month. ITB surged 13.6% in August, while XHB climbed 11.9%, delivering 10 percentage points of alpha to the S&P 500.
August Returns: ITB and XHB Trounced the S&P 500
It’s critical for investors to understand that these two homebuilder ETFs are quite different. ITB is cap-weighted, so it’s heavily influenced by shares of D.R. Horton (DHI), Lennar (LEN), and PulteGroup (PHM), among others. Conversely, XHB is nearly equally weighted, reducing single-stock risk. XHB’s smaller average market cap size effectively makes it more of a mid-cap fund, which introduces more potential economic sensitivity. So there are trade-offs.
The Bottom Line
This week’s heavy dose of macro data is likely to spark volatility, at times, in the stock and bond markets. I urge readers to pay attention to actual price action rather than media narratives, particularly around the 10-year Treasury rate. With mortgage rates at an 11-month low, homebuilder stocks deserve close attention.
Disclaimer: This blog is for educational purposes only and should not be construed as financial advice. The ideas and strategies should never be used without first assessing your own personal and financial situation, or without consulting a financial professional.


