China Stocks Step Back Into the Spotlight: Here's What Investors Need to Know

Key Takeaways
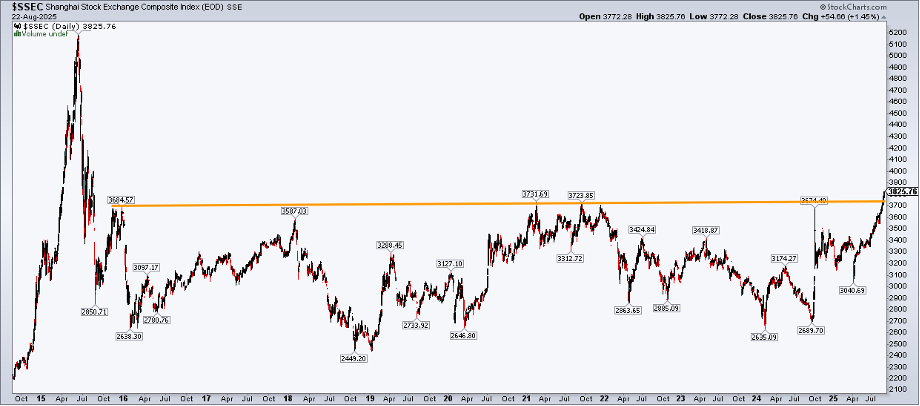
- The Shanghai Composite has climbed to 10-year highs.
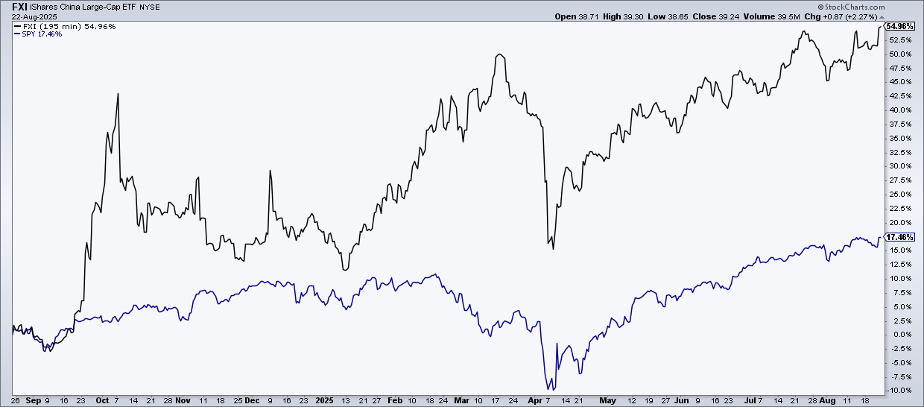
- The FXI China Large-Cap ETF boasts big alpha to the S&P 500 YoY.
- I outline key price levels to watch on FXI heading into year-end.
NVIDIA (NVDA) reports Q2 earnings Wednesday night, but it’s also a busy week for quarterly updates from Chinese companies. PDD Holdings (PDD) issued strong top- and bottom-line numbers on Monday morning, sending shares on a roller-coaster ride. The heavy hitter steps to the plate later this week — Alibaba (BABA) reports second-quarter results Friday morning. In addition, Li Auto (LI) posts up on Thursday before the bell.
Why Chinese Equities Are Back in Play
Chinese stocks have been on a strong run lately. The Shanghai Composite has ascended to 10-year highs, while the Hang Seng Index is a stone’s throw from its best level going back to late 2021. For US investors, perhaps the easiest way to play it is through the iShares China Large-Cap ETF (FXI). FXI is a medium-to-large ETF, housing $6.7 billion of assets under management. The size is not huge, but year-on-year returns have been gaudy.
FXI is up 55% over the past 12 months, dividends included. That’s almost 40 percentage points of alpha compared to the S&P 500 ETF (SPY). China large caps’ rally has been anything but a straight line since the middle of 2024’s third quarter, however.
Macro investors might recall the massive stimulus measures enacted by Chinese monetary policy authorities in September 2024. There was also some fiscal juice injected into the world’s second-largest economy 11 months ago, as China struggled with weak consumer spending, rising unemployment (particularly among its younger workers), and outright deflation in several wholesale price categories. Its PPI remains sharply negative, but technical traders should care little about that.
Notice in the chart below that FXI sports significant relative strength to the S&P 500 since the start of the year. No doubt aided by the aforementioned stimulus activity, a weaker dollar has also been a tailwind.
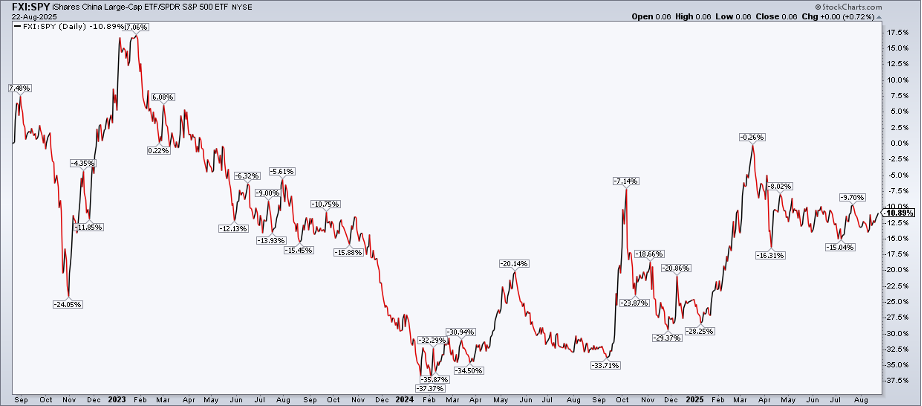
Zoom out the relative chart a few years, however, and we’ll find that FXI might already be in a protracted bull run. Shares notched a low in January of 2024, a time when the macro cacophony proclaimed Chinese equities a no-touch. “Uninvestable” was the lone descriptor, and many investors still hold that view.
Reading the Charts: Technical Strength Behind the Rally
Price action tells a more sanguine story, though. Let’s walk through a detailed view of FXI’s technicals to get a sense of what the next move could be.
First, when I analyze either ADR charts or country funds, I generally use line graphs (not candlesticks). You see, with heavy trading among its underlying holdings in foreign exchanges, there can be Common Gaps that simply don’t matter. Even experienced traders should ensure the chart type selected matches the security being analyzed.
FXI settled last week at its best price, going back to Q4 2021. The rally was all the more powerful considering that it came on a weekly close. The bulls should find appeal in the fund’s rising long-term 200-day moving average, while the 50-dma is also climbing. Price is above both trend-indicator lines, asserting that the bulls control the primary trend. Indeed, a series of higher highs and higher lows has occurred since January of last year, with the steep downtrend from the February 2021 post-COVID surge ending long ago.
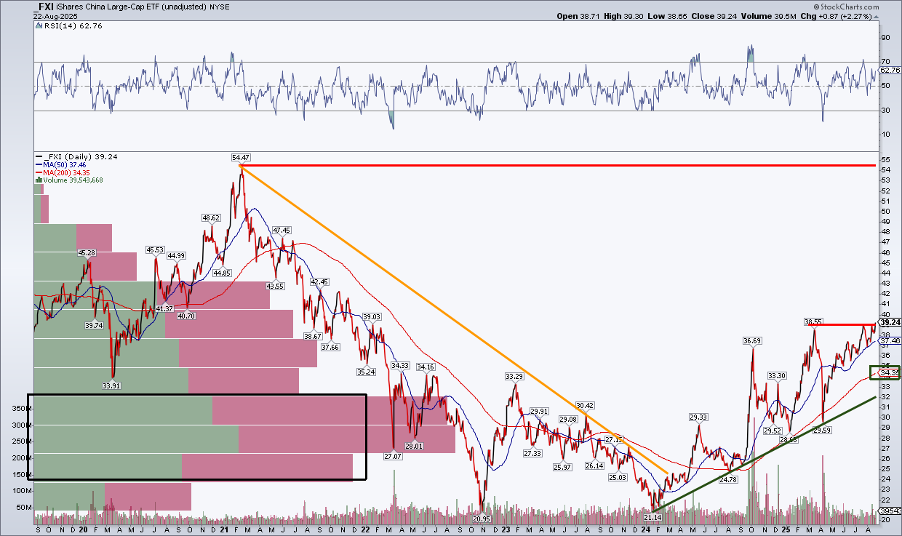
Though this decade’s peak is another 39% higher from the current price, FXI has managed to work its way through a significant amount of volume-by-price (the green and red bars on the left side of the chart). This rarely applied indicator is handy, in my view, as it shows where supply and demand may lie. With a significant amount of shares traded now below FXI’s price, there should be ample cushion if we see a pullback.
Not drawn on the chart, so as not to clutter the view, are the Fibonacci retracement levels. Let’s look at those separately.
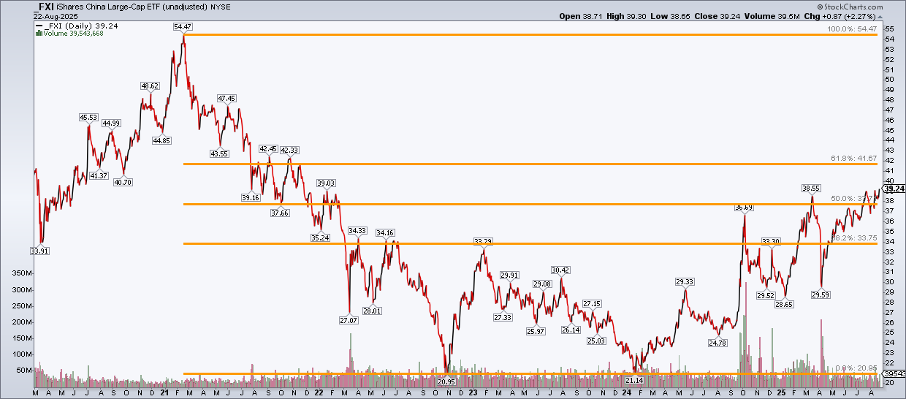
The 61.8% retracement mark is our bogey; it comes into the picture at $41.67, which is just modestly above the current level. It has some confluence with where FXI topped out from September to November of 2021 (when many US stocks peaked before the 2022 bear market).
What to Watch Next
FXI has been bouncing off its 50-dma throughout this quarter. Thus, it’s reasonable to assume that it will persist as support. Firmer support could appear at the 38.2% line and the December 2024 rebound high between $33 and $34.
We can also use the March-April decline from $38.55 to $29.59, and presumed upside breakout through $38.55, to project a measured move price objective to $47.50.
Ultimately, I want to see FXI spike against the S&P 500, like we saw in September–October 2024 and from January 2025 through the middle of this past March. Alpha periods have historically happened in bursts, and the fund appears poised for another to occur soon.
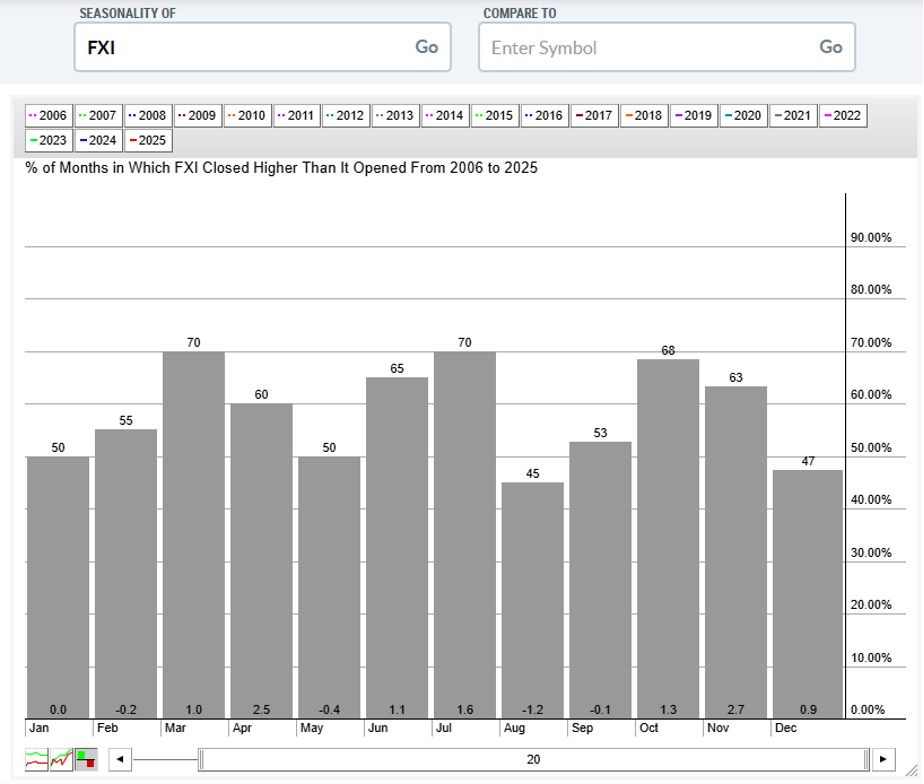
Readers know that I like to eye seasonality, and September is actually not that bad, averaging a flat return since 2006. October–November has been FXI’s best stretch in the past two decades.
The Bottom Line
US mega-caps, Europe, and even Japan have garnered plenty of fanfare this year. There has been an elegant handoff of outperformance among those plays, but global investors should not dismiss Chinese equities right now. FXI is up 50% year-on-year, and while it has merely trodden water with the SPX since Q2, there’s the potential for another explosive absolute and relative rally.


