Defensive Sectors Surge as Hindenburg Omen Flashes Warning

Despite a fairly significant leadership rotation in the S&P 500 index, with previously high-flying growth stocks languishing as value sectors dominate, the major US benchmarks have remained in a relatively strong technical configuration.
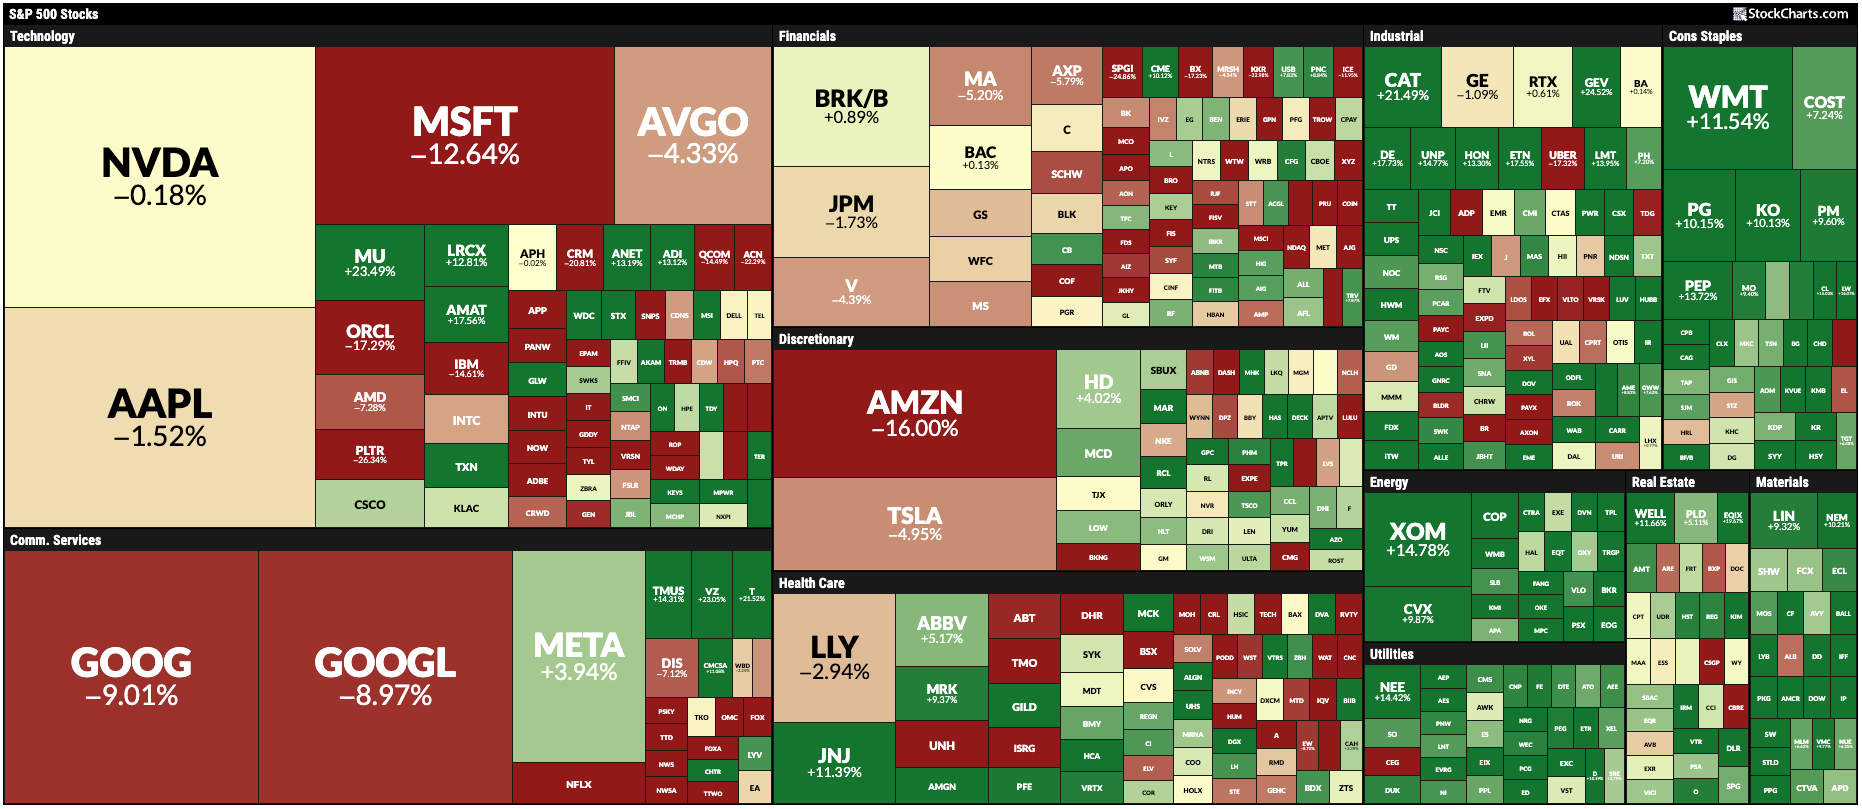
We’ve been tracking the leadership rotation theme on our daily market recap show, as cyclical sectors, including Industrials and Energy, have experienced strong gains over the last month. As you can see from the one-month MarketCarpet showing S&P 500 constituent performance, defensive plays, including Utilities, Consumer Staples, and even Real Estate, experienced double-digit gains this week as growth sectors mostly struggled.
Today, we’ll share an update on the Hindenburg Omen, which completed another confirmed signal this week. We’ll also demonstrate how, even though the S&P 500 finished the week in our “neutral” range in terms of price and momentum, the clear rotation to defensive sectors implies investors are getting cautious into mid-February.
Hindenburg Omen Fires Confirmed Signal
Even though the mega-cap growth trade has struggled so far in 2026, market breadth conditions remain decidedly robust. There have been plenty of new 52-week highs to discover; they just haven’t been in the growth sectors. But there have also been enough 52-week lows to trigger that dreaded macro technical signal, the Hindenburg Omen.
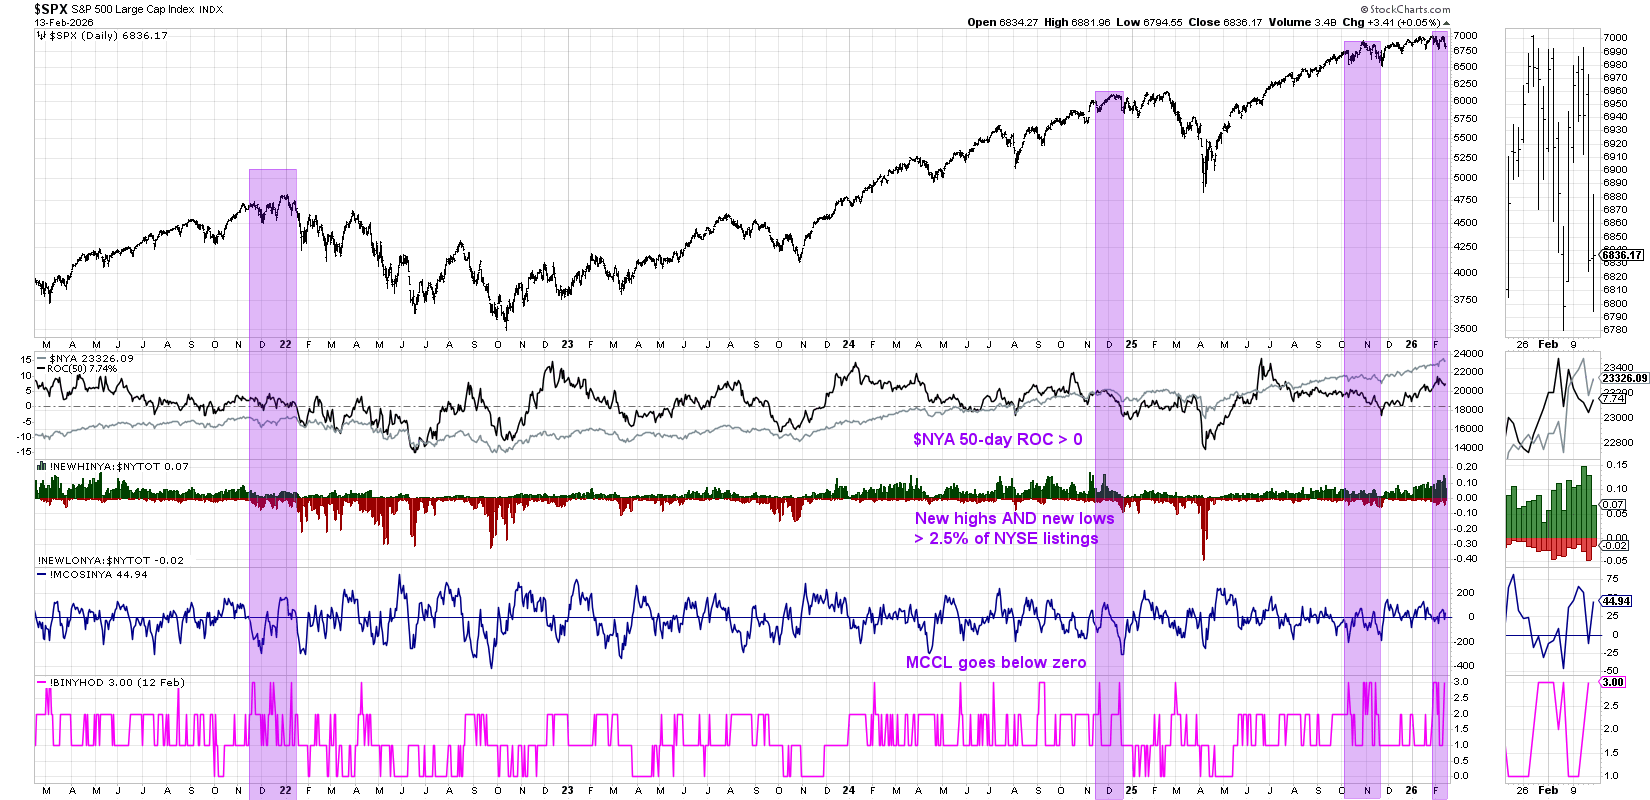
The Hindenburg Omen last fired in November 2025, with the S&P 500 index dropping to 6500 just before Thanksgiving. But a recovery in December reset the indicator and left investors looking for another signal of a potential market top.
Over the last two weeks, there have been plenty of charts in confirmed downtrends, resulting in enough new 52-week lows to validate the omen. Also, short-term market breadth readings have turned bearish, as represented by the McClellan Oscillator dipping below the zero line. And with multiple signals within one month, we have to declare the second valid Hindenburg Omen signal since the April 2025 market low.
Traffic Light Technique Still Neutral
Despite the ominous market signal outlined above, the S&P 500 still remains in a neutral stance. Our main US equity index has oscillated between support around 6800 and resistance just below the 7000 level. A review of the Relative Strength Index (RSI), however, shows the real story of a balance between buyers and sellers.
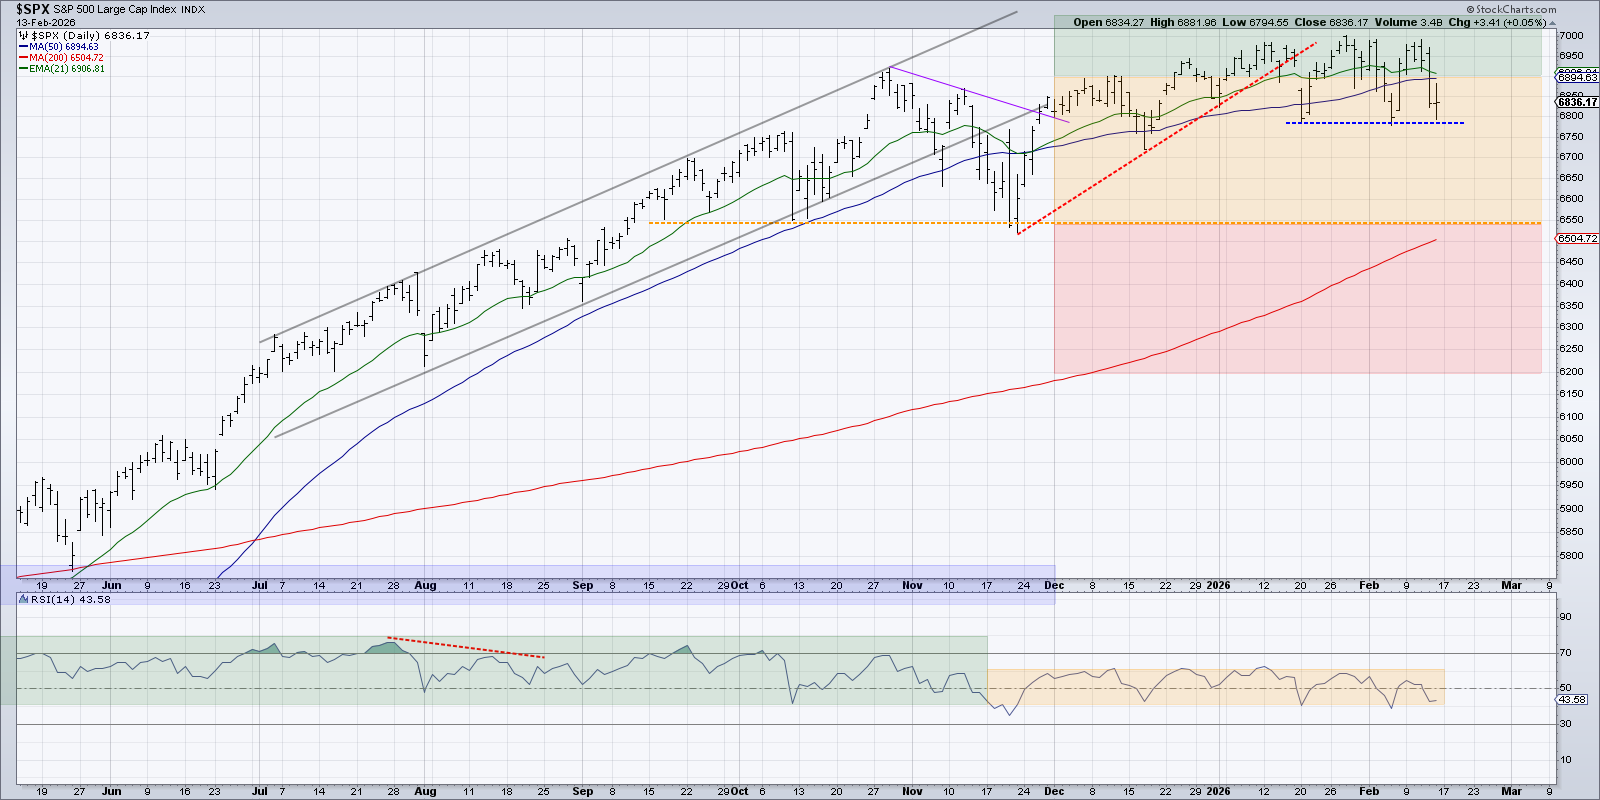
During a consolidation phase, the sideways price action implies that bulls and bears are in equilibrium. With equal strength on up days and down days, the RSI has revolved around the 50 level since November. In the short-term, we’re watching the recent swing lows around 6800 as an important tactical support level.
If the SPX makes a new swing low, we’d look for downside support around 6550 based on the October and November lows. The 200-day moving average lines up well with this pivot point, implying a “confluence of support” and an absolutely crucial level to watch.
Rotation to Defensive Sectors
What gives us confidence that a test of support is in the works? The improvement in three defensive sectors — Consumer Staples, Utilities, and Real Estate — indicates a rotation to defensive positioning in a risk-off move by investors.
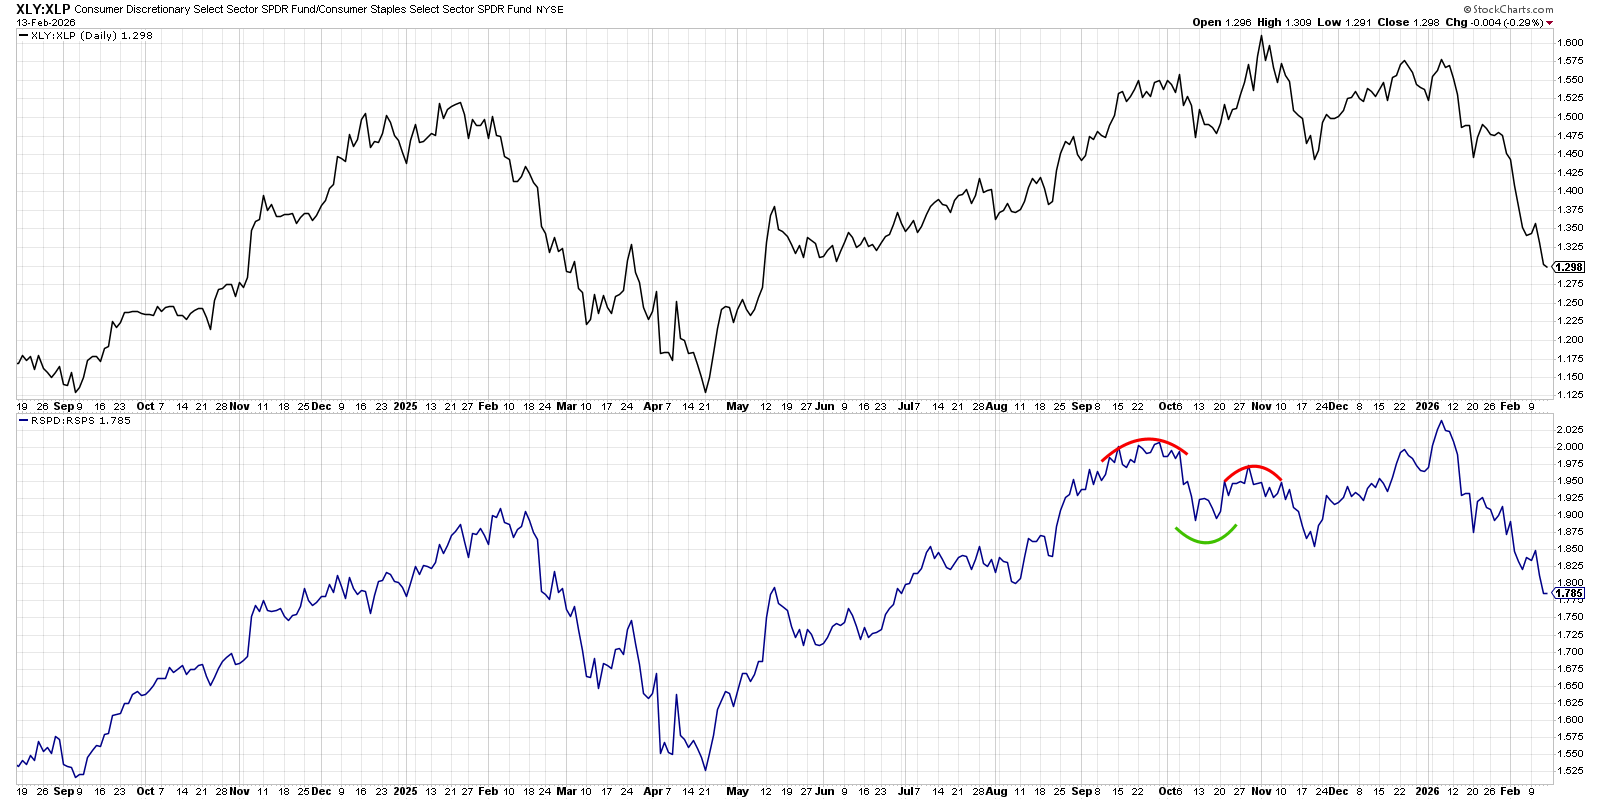
Our “offense vs. defense” chart evaluates the relative performance of the Consumer Discretionary vs. Consumer Staples sectors, shown with both cap-weighted and equal-weighted ETFs. Both of these ratios have been trending lower since the beginning of 2026, and both ratios reached another new three-month low this week.
Given the bearish Hindenburg Omen confirmation this week, along with the general rotation into defensive and income-oriented equity sectors, we see an increased likelihood of deterioration in the major equity indexes. A break below support at SPX 6800 would confirm a pullback scenario; we’re considering 6550 the ultimate “line in the sand” for our languishing US equity benchmark.
One more thing — we had a fantastic mailbag episode of our daily market recap show, covering viewer questions on everything from candle patterns to technical analysis during earnings season. We even had a question this week on the “percentage change” annotation tool on StockCharts!
Check it out on our YouTube channel:
RR#6,
Dave
P.S. Ready to upgrade your investment process? Check out my free behavioral investing course!
David Keller, CMT
President and Chief Strategist
Sierra Alpha Research LLC
marketmisbehavior.com
https://www.youtube.com/c/MarketMisbehavior
Disclaimer: This blog is for educational purposes only and should not be construed as financial advice. The ideas and strategies should never be used without first assessing your own personal and financial situation, or without consulting a financial professional.
The author does not have a position in mentioned securities at the time of publication. Any opinions expressed herein are solely those of the author and do not in any way represent the views or opinions of any other person or entity.


