Defensive Strength: Three Consumer Staples Charts Leading the Market

The S&P 500 closed slightly down for the week, with growth sectors like Communication Services and Consumer Discretionary sitting toward the bottom of the leaderboard. But which sectors managed to push upward this week, saving the equity benchmarks from a big-time distribution week?
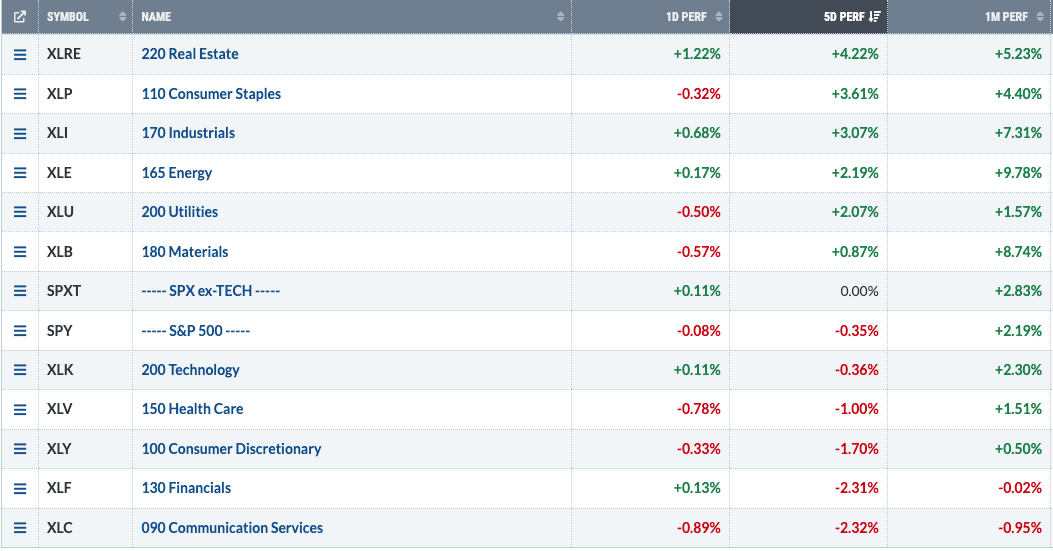
Real Estate led the way higher, up 4.2% for the week compared to the S&P 500’s -0.4%. The second place sector was Consumer Staples, leading me to dig a little deeper into which charts helped the traditionally defensive sectors finish the week at the top of the performance table.
Today, we’ll break down three charts in the Consumer Staples sector demonstrating constructive technical configurations, serving as an excellent reminder that strong charts can truly emerge in any sector at any point.
Costco Wholesale Corp. (COST)
Big box retailers, including Target (TGT) and Walmart (WMT), have been rotating higher in January, but I think Costco (COST) represents an actionable opportunity, with this week’s break above the 200-day moving average.
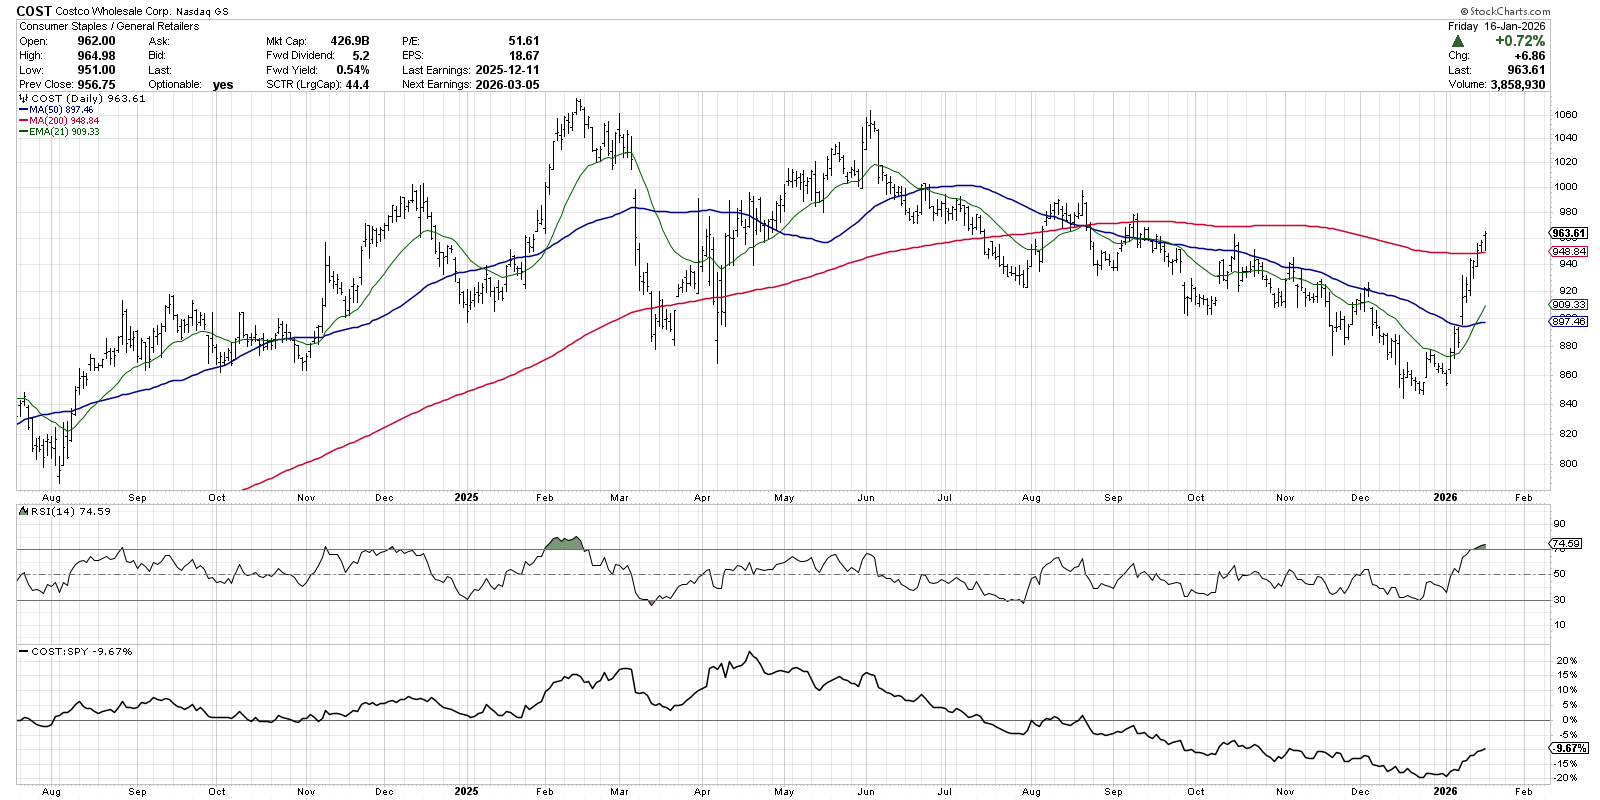
After breaking below the 200-day back in June 2025, COST was in a consistent downtrend pattern of lower lows and lower highs. Countertrend rallies tended to stall out at the 50-day moving averages, and all moving averages were sloping downwards. In the first couple of weeks of January, Costco appeared to quickly reverse that downtrend phase, gaining about 12% since the end of December.
COST is now overbought as it breaks above the 200-day moving average, which means I’d be watching for a potential pullback. Most importantly, the RSI should ideally remain above the 40 level on any pullback event, as that would serve to confirm that the stock is still in a primary uptrend.
Philip Morris Intl Inc. (PM)
Tobacco company Philip Morris also broke above its 200-day moving average, which also meant a new three-month price high. Just before the moving average breakout, a pullback to test a previous pivot point around $155 ended up providing an excellent confirmation of the new accumulation phase.
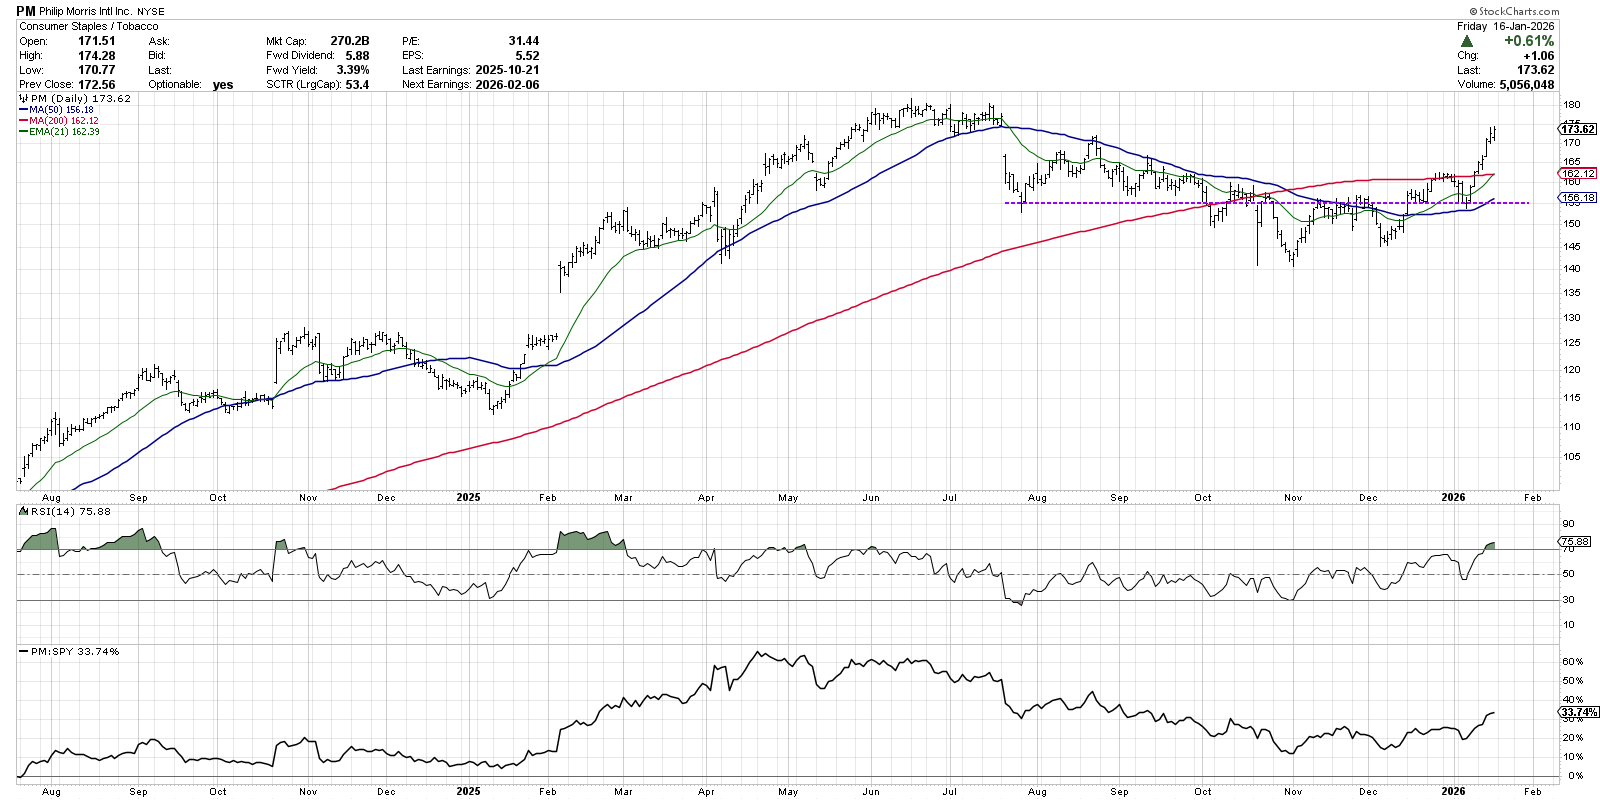
Similar to Costco, PM experienced weaker momentum readings during the distribution phase. Note how the RSI pushed down below 30 in July 2025 on the initial gap lower, and then remained below the 60 level on countertrend bounces during the downtrend phase. Over the last six weeks, this bearish momentum structure has reversed into a bullish configuration.
Similar to COST, I’d like to see Philip Morris hold an RSI 40 level if there is a pullback from the current overbought condition. The 200-day moving average currently sits around $162, lining up fairly well with the late December swing high. Holding this level on a price basis would suggest that the accumulation phase is still intact.
Dollar Tree, Inc. (DLTR)
Dollar stores have been on a tear since back in October, and Dollar Tree provides a classic example of a strong chart just getting stronger. Upward sloping moving averages speak to the strength of the uptrend phase, with higher highs and higher lows defining the chart in recent months.
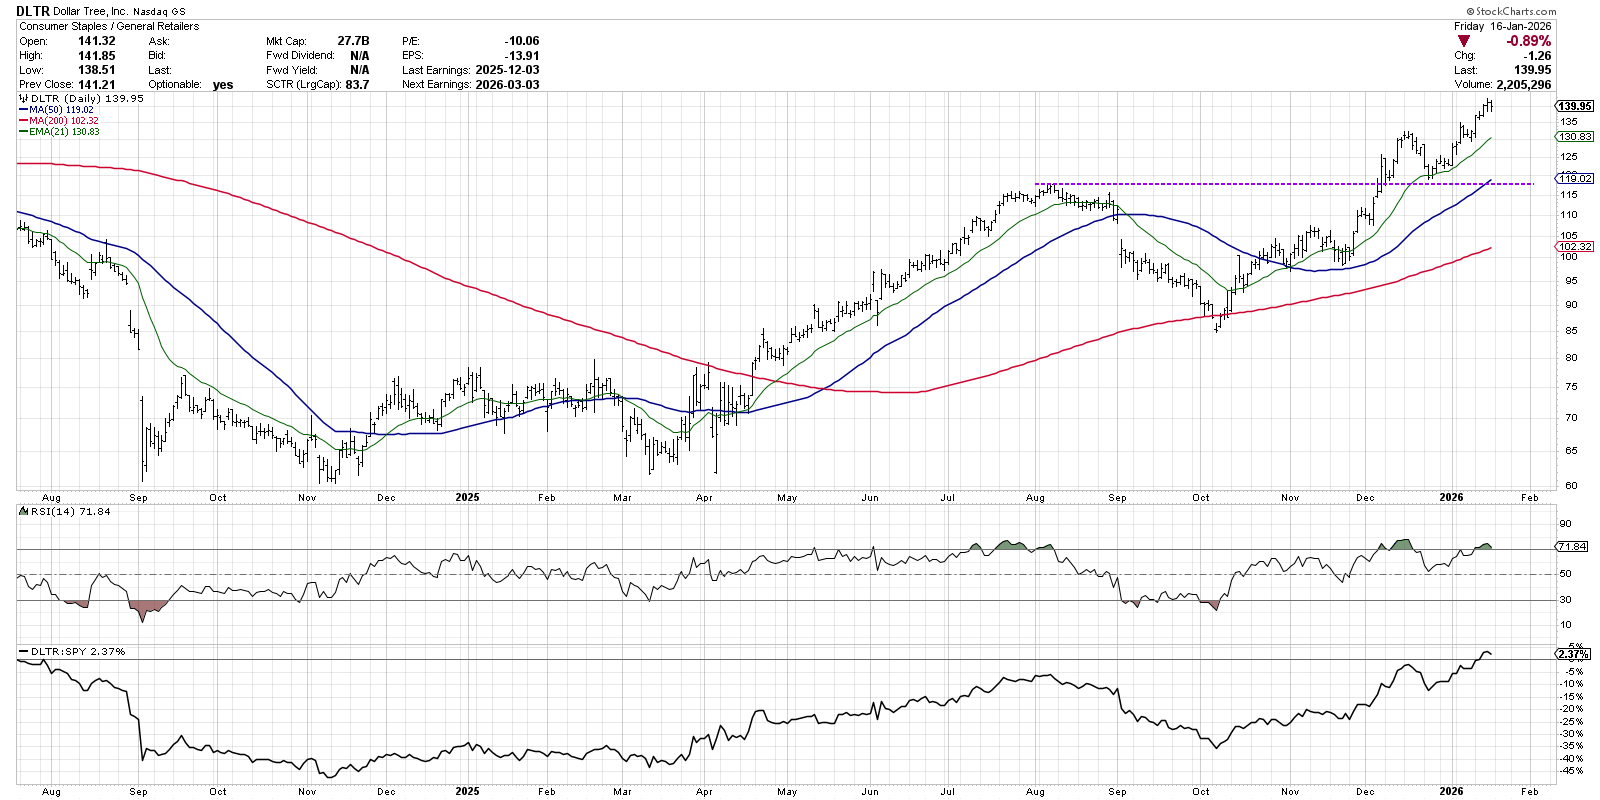
I like to use the 21-day exponential moving average as an initial stop level for charts in strong uptrend phases. While a break of the 21-day EMA would not necessarily mean a major correction for a chart like DLTR, it would at least tell me that the dynamics are shifting for the stock.
Just as with the previous two stocks, Dollar Tree is overbought with an RSI above 70. Again, on its own, this does not suggest the stock will turn lower. In fact, overbought conditions often emerge in early stages of a new uptrend! We can see examples of this phenomenon back in May and June of last year. For now, I would consider this chart “innocent until proven guilty.”
Investors often avoid traditionally defensive sectors such as Consumer Staples because they are bullish on the overall market. And why would we want to own defensive stocks if the market trend is still positive? As I prefer to sign off my daily market recap show, “It’s always a good time to own good charts.”
RR#6,
Dave
P.S. Ready to upgrade your investment process? Check out my free behavioral investing course!
David Keller, CMT
President and Chief Strategist
Sierra Alpha Research LLC
marketmisbehavior.com
https://www.youtube.com/c/MarketMisbehavior
Disclaimer: This blog is for educational purposes only and should not be construed as financial advice. The ideas and strategies should never be used without first assessing your own personal and financial situation, or without consulting a financial professional.
The author does not have a position in mentioned securities at the time of publication. Any opinions expressed herein are solely those of the author and do not in any way represent the views or opinions of any other person or entity.


