Did The Strong Reversal on Friday Mark The Bottom?

That headline is a really great question.
To begin, let me start from a longer-term perspective, where I remain very bullish. There's a lot of noise right now, but that doesn't change the fact that interest rates are likely to decline further at some point, even if not in December. Also, earnings came in very strong for Q3, with the overwhelming majority (80%+) of S&P 500 companies beating earnings estimates. This is a recipe for higher equity prices.
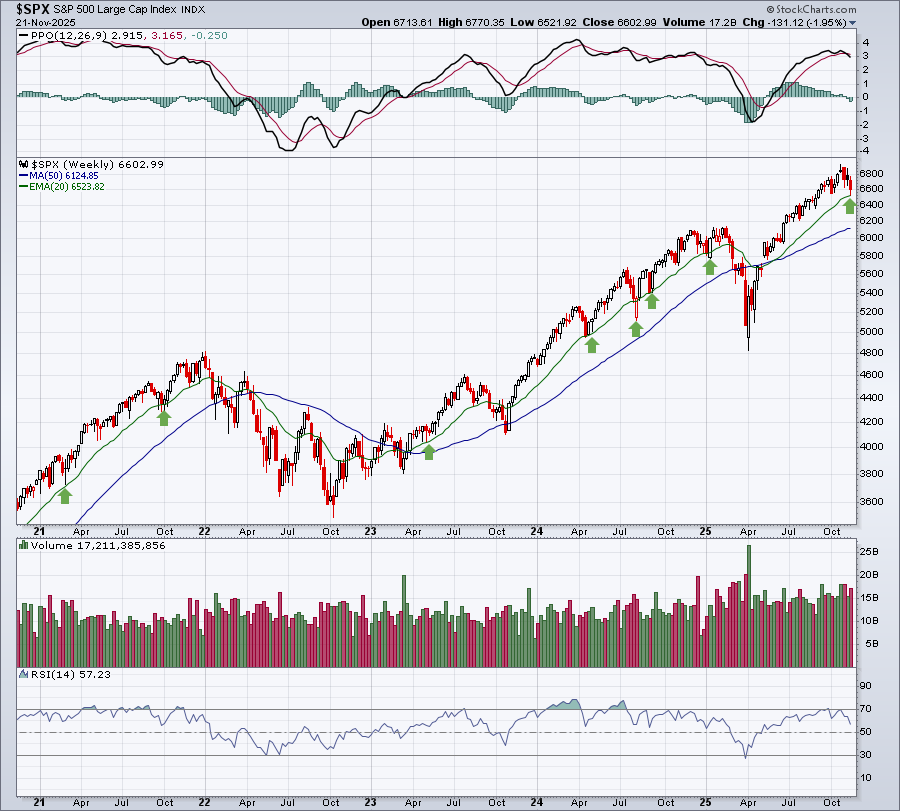
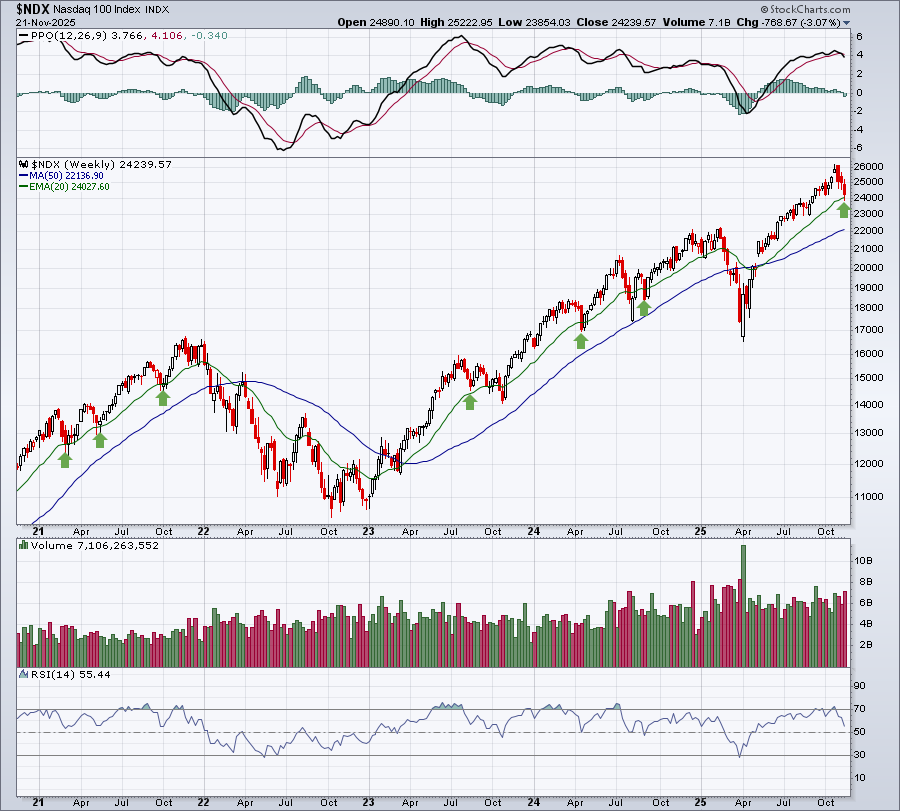
There's certainly an argument that our major indices did what they needed to do — test key rising 20-week EMAs. It's clear that this test was successful, at least for now.
S&P 500
Nasdaq 100
So far so good, right?
Sentiment
Another positive for the bulls is that sentiment is moving towards bearish extremes. That's always a good sign as increasing fear has a long history of marking key market bottoms. Check out this chart of the Cboe Volatility Index ($VIX) below.
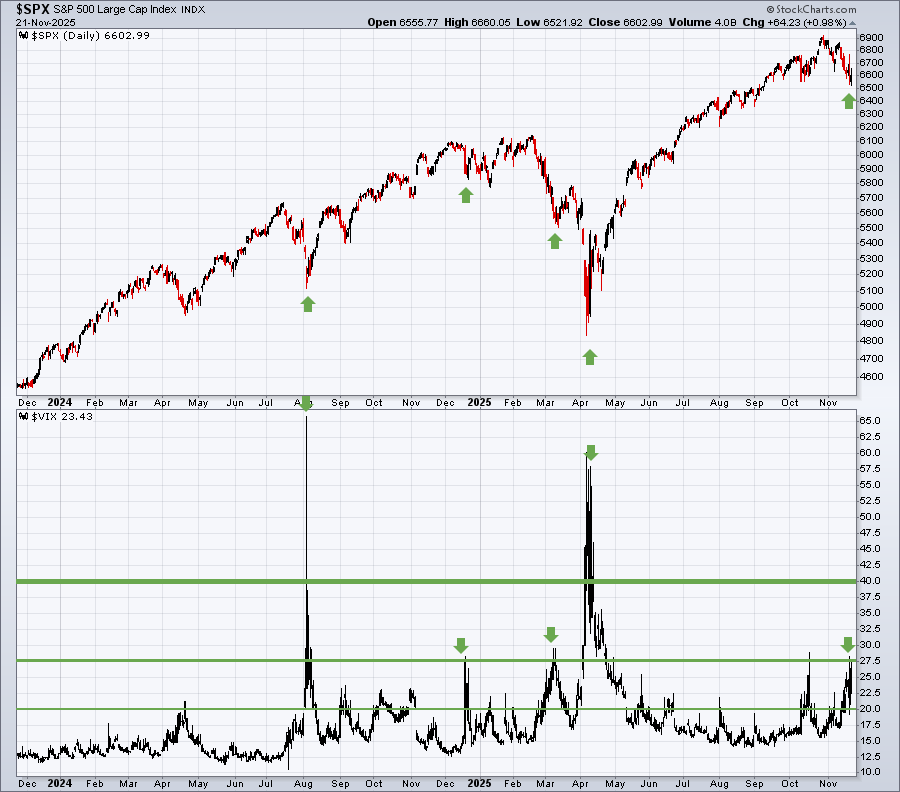
We've seen the S&P 500 bottom and the VIX top when the VIX reaches the upper 20s to around 30. On two occasions, however, the selling deepened and the VIX soared way above 30. Which will it be this time? We don't know, but I do always keep in mind that we're in a secular bull market, so I give the benefit of the doubt to the bulls.
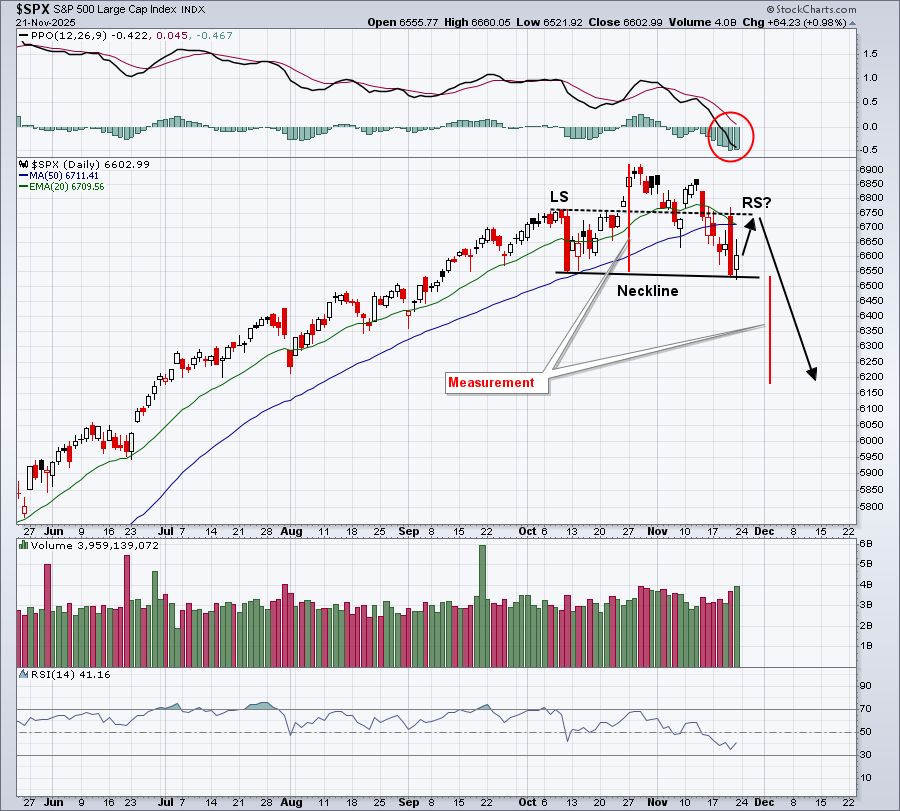
All that said, there are clear bearish patterns in play right now and we can't completely ignore those. For instance, both the S&P 500 and NASDAQ 100 have established down-sloping necklines on their respective daily charts.
The NASDAQ 100's chart looks very similar and areas that had been leading throughout much of 2025 are really struggling right now. These include semiconductors ($DJUSSC) and electrical components and equipment ($DJUSEC). Check out the latter's chart.
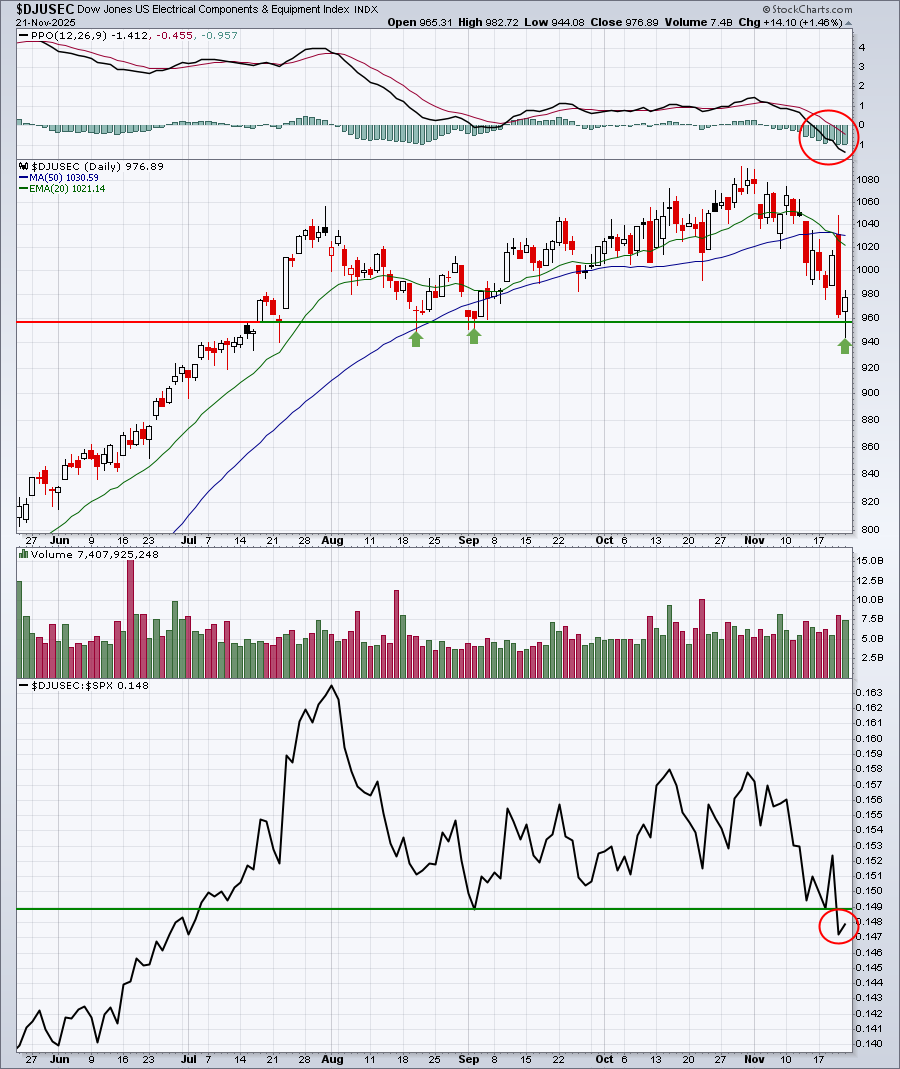
Holding onto price support is certainly a short-term positive, but the chart overall is deteriorating. We saw a bearish PPO centerline crossover recently and, perhaps more importantly, relative strength in this group moved to a 5-month relative low. That's starting to look like more than just a period of profit taking.
What to Do From Here?
I'd exercise a lot of caution, from a short-term perspective, but I remain very bullish longer-term. I cannot rule out further downside, especially if we see the S&P 500 and NASDAQ 100 move up to hit overhead resistance at their 20-day EMA and/or 50-day SMA to establish right shoulders and then fail. The interesting part about the potential head-and-shoulders pattern measurement is that it would take the S&P 500 down to roughly where it broke out in June 2025, above its prior 6144 price resistance.
I'm picking my spots for trades on the long side. It's extremely important to exercise patience and allow stocks to pull back to critical support levels. That enables us to enter with limited downside risk. If support doesn't hold, we simply exit with nearly all of our capital still intact.
I entered one stock late on Friday, because it was doing exactly that — pulling back and testing a MAJOR support level. I'm including it on Monday in our EB Digest newsletter. This newsletter is FREE and, if you aren't already subscribed, you can CLICK HERE and join to receive this stock on Monday.
Happy trading!
Tom


