Don’t Get Squeezed: Using TTM to Stay Head of Wall Street
If you follow the stock market, you know that September is supposed to be a soft month. Well, not this year. So far, all three major indexes are up and, with just two trading days left, it’s looking like the month could finish on solid footing.
Here’s how the major indexes have performed to date in September.
- S&P 500 ($SPX): 6,643.70 (+2.84%)
- Nasdaq Composite ($COMPQ): 22,484.07 (+4.79%)
- Dow Industrials ($INDU): 46,247.29 (+1.54%)
The optimism surrounding a market that keeps moving higher can easily sweep us away and make us forget that things could quickly reverse. The reality is the market can surprise you when you least expect it. This is why, as an investor, it pays to stay engaged with the market and look for early signals, both positive and negative.
A New Indicator: TTM Squeeze (now in SharpCharts)
Markets move in phases. They trend, pause, and trend again. The TTM Squeeze indicator (you can find this in the Indicator dropdown under the Volatility category) helps you spot the transition from one phase to the next, showing the following:
- When a consolidation starts to build energy.
- When a new move is starting.
- When the move is running out of steam.
Take a look at the daily chart of SPY below:
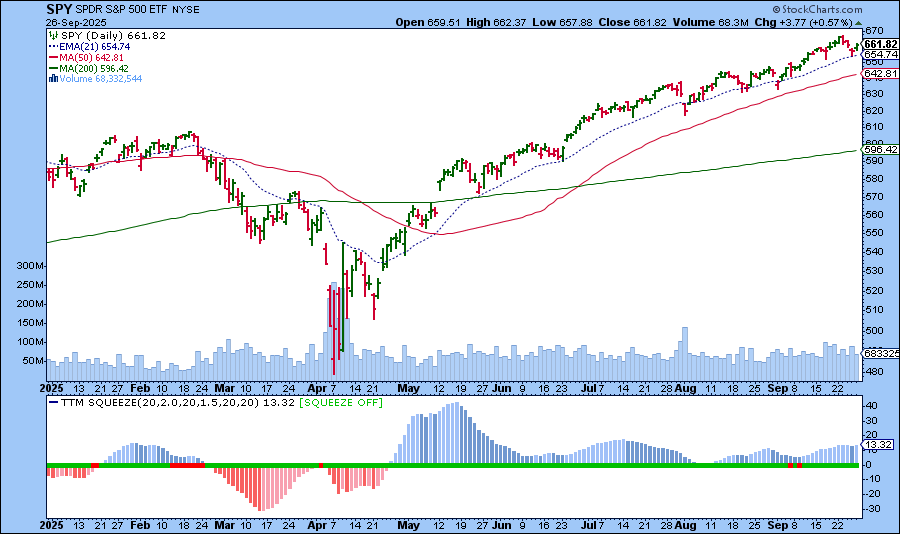
The TTM Squeeze histogram (bottom panel) is still in positive territory, with a series of green dots on the zero line. This is an indication that the uptrend is still intact. Contrast this with what happened between February and April, 2025. Prior to the histogram moving into negative territory, you can see a series of red dots, an indication that the squeeze is on. The histogram bars were also approaching the zero line, a warning that the previous uptrend was fizzling. We’re not seeing that setup today, but it’s worth monitoring the TTM for those early signs of the trend coming to an end.
There’s no one “right” way to analyze the market, but tools like the TTM Squeeze, along with breadth and sentiment, can help you stay one step ahead.
You’re Invited: Livestream with Tom Bowley
On Saturday, September 27, at 10 AM ET, join Tom Bowley, Chief Market Strategist at EarningsBeats.com, for a FREE livestream. He’ll reveal two key ways Wall Street’s target updates often miss the mark. You’ll also discover chart signals Tom uses to anticipate big moves before the headlines hit, and you’ll find out about his favorite area of the market to watch in Q4.
Reserve your free spot: REGISTER NOW! Even if you can’t attend the live event, you can register to receive a time-stamped replay from EarningsBeats.com.
Enjoy your weekend, and we’ll see you next week with more market insights and charting tips.


