Dow at 50,000, Tech Pauses: Inside the Market’s Breadth Rotation

Key Takeaways
- Macro data is back under the spotlight this week after a short-lived February government shutdown.
- Three-quarters of S&P 500 earnings reports are in, and broadening was the price-response theme.
- A trio of market breadth indicators is under the microscope to discover if non-tech strength can sustain the bull market.
The focus shifts back toward the macro this week. We’ll get December Retail Sales on Tuesday, January payrolls on Wednesday, and last month’s CPI report on Friday, ahead of the three-day weekend. The pivot comes after a wild week of software carnage to kick off February and some of the best “broadening” price action seen so far in the bull market.
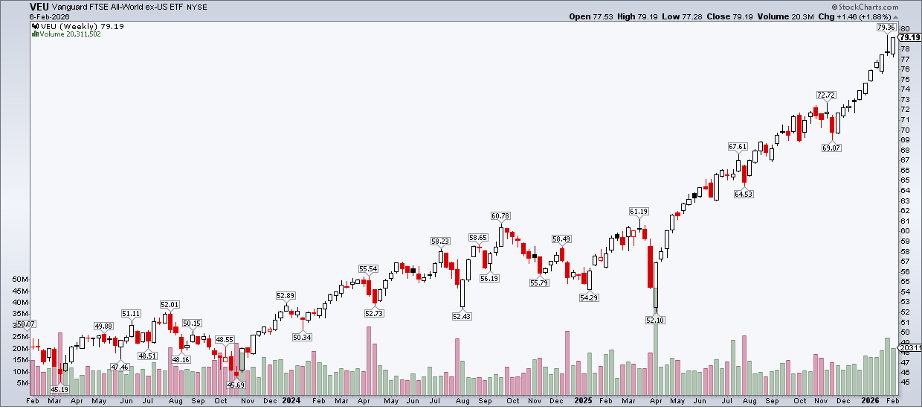
Now, there are two ways we could take this. Bears can focus on the badly damaged software charts, while bulls cheer on areas like the S&P 500 Equal Weight Index, the Dow Jones Industrial and Transportation Averages, and the record highs in U.S. small- and mid-cap stocks. International equities also logged their 11th consecutive up week to begin the month. From a nonpartisan perspective, there's more green than red, with the average global stock running higher.
Using SCTR to Identify Leadership
In moments like this, I find the StockCharts Technical Rank (SCTR) indicator revealing. The SCTR is a numerical score ranking a stock within a group of stocks — think of it like a relative strength tool.
The scores range from 0 to 99, and are calculated using six technical indicators across three timeframes, heavily weighted toward the long term (60%) and medium term (30%), with only 10% based on short-term momentum. It ranks stocks, industries, and sectors and helps identify current winners and losers — ideal for swing traders.
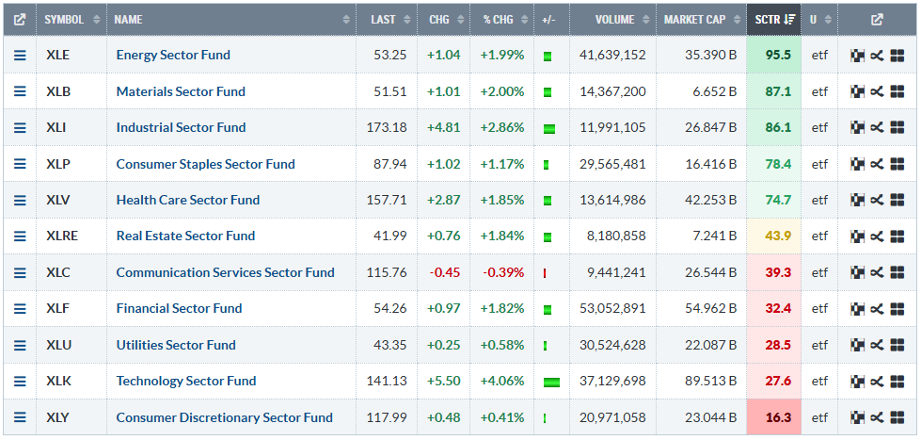
With the bulk of Q4 S&P 500 earnings in hand, blue-chip sectors are top of the SCTR stack. Energy (XLE) boasts a high 95.5, while Materials (XLB) and Industrials (XLI) are just below 90 — quite strong. The market bifurcation is significant, given low sub-30 SCTR scores within Utilities (XLU), Information Technology (XLK), and Consumer Discretionary (XLY).
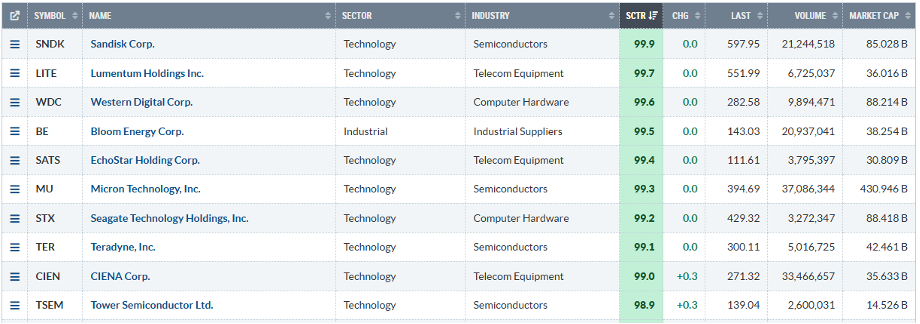
You can view the data and do some sector prospecting on your own within the StockCharts Sector Drill-Down page. The SCTR Reports view allows traders to find the highest-ranking equities by market cap — SanDisk (SNDK) has a perfect 99.9 score. Other Information Technology stocks litter the top of the stack, showcasing the have/have-not nature of tech at the moment.
Market Breadth Confirms Rotation
Unlike the U.S. economy, today’s stock market features far more winners than losers. The Bullish Percent Index (BPI) indicator is like the tag-team partner of the SCTR score. StockCharts maintains and publishes the Bullish Percent Index for over a dozen indices and sectors. The BPI is a breadth indicator that shows the percentage of stocks with Point & Figure buy signals, a rules-based system for identifying stocks that are going up or down.
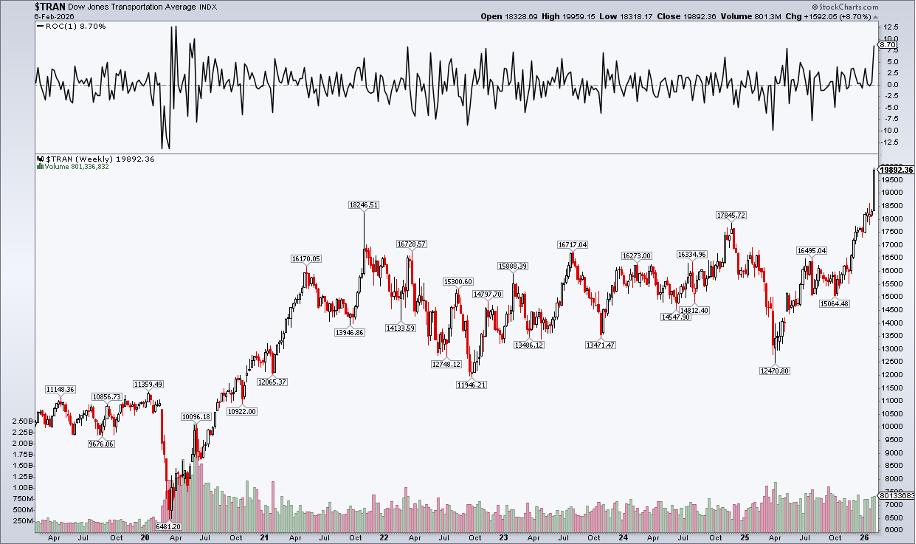
I found myself sifting through the curated list of Major BPI Charts last week, given the major intramarket moving and shaking. Today, as earnings season quiets down and macro reports roll in, the NYSE Bullish Percent Index is strong, above 60. Conversely, the Nasdaq 100’s BPI has slipped below 40. The Dow Jones Transportation Index ($TRAN) scored its best week since June 2020 amid the software shakeout — $TRAN’s BPI chugs along at 90.
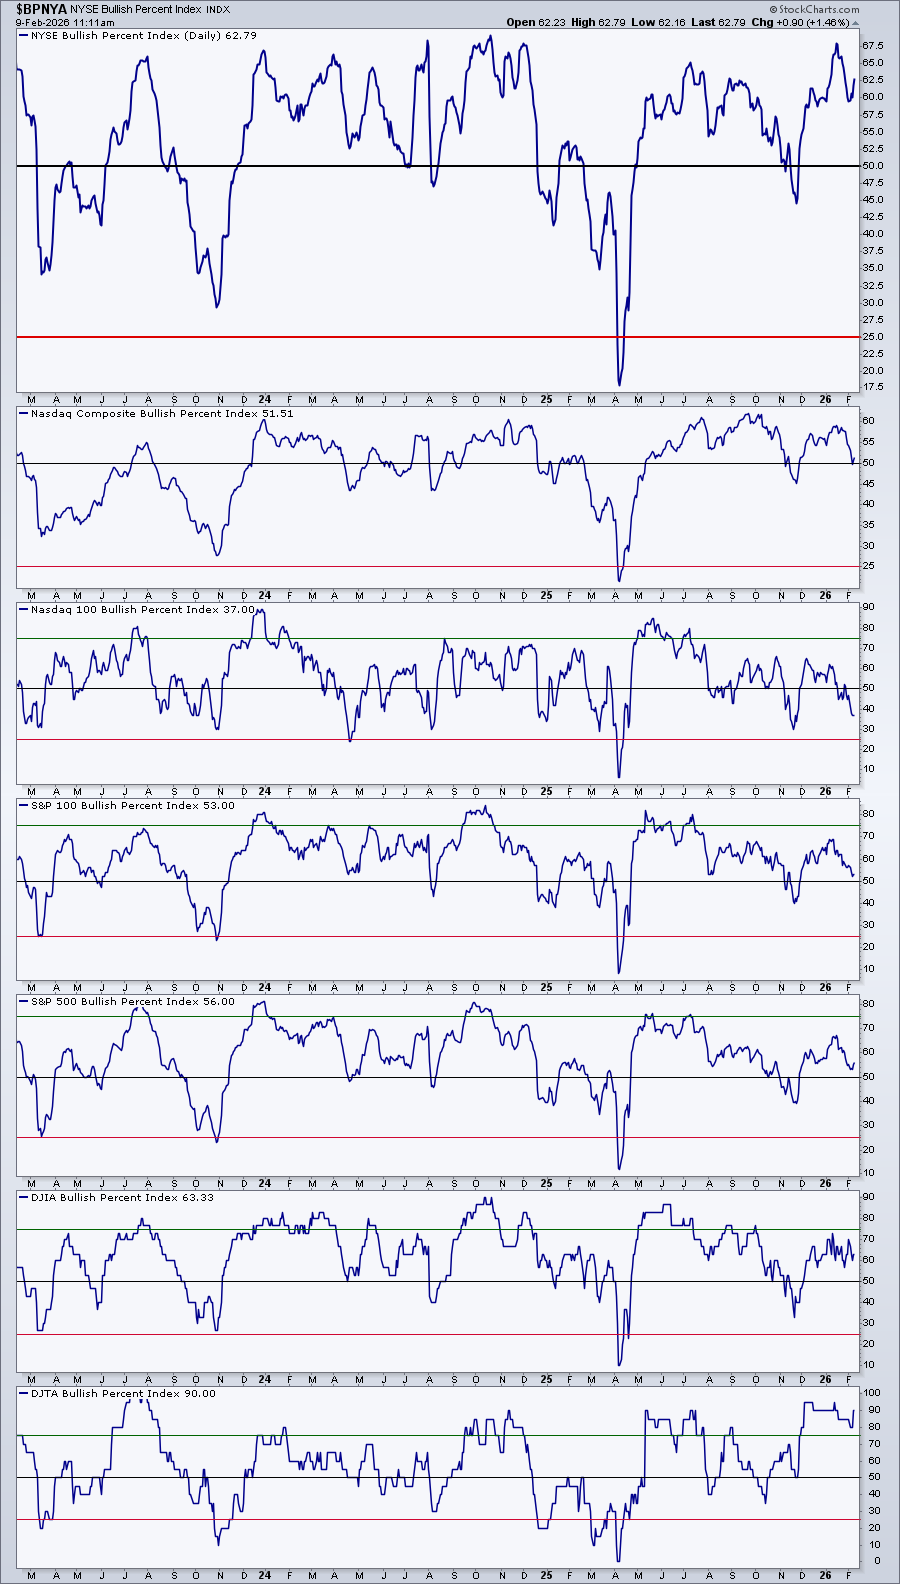
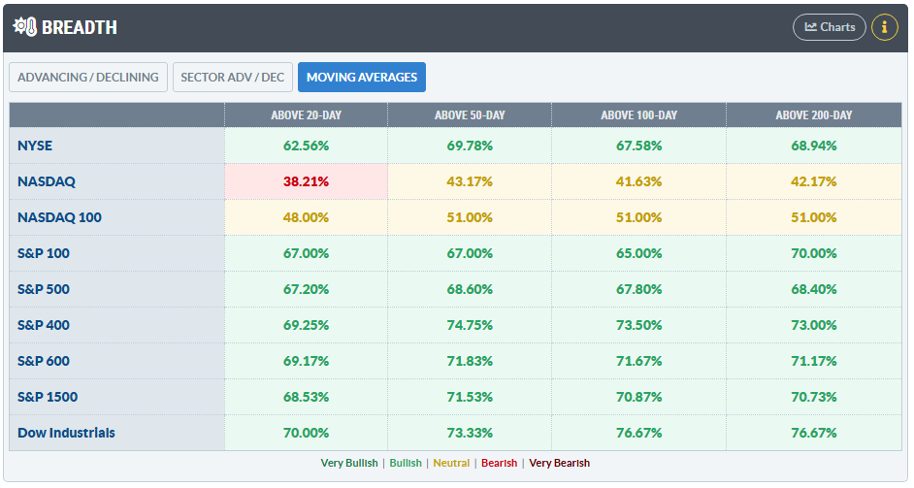
Staying on board the Market Summary page, a third market snapshot confirms 2026’s tone shift from the early part of the bull market that began in October 2022. The Breadth box displays current-day advancers/decliners, sector advancers/decliners, and where major U.S. indices’ components trade relative to several moving averages.
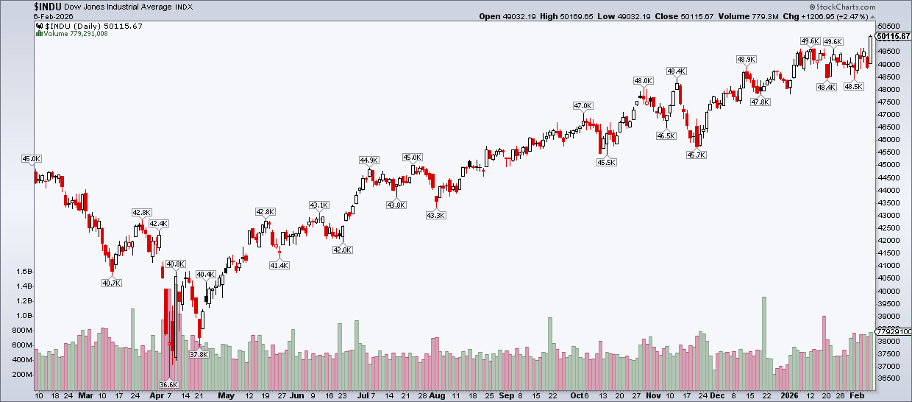
The Nasdaq Composite and Nasdaq 100 stick out in a glum way. Fewer than four in 10 Nasdaq stocks trade above their respective 20-day moving averages. Just 42% of the tech-heavy index’s names are above the 200-day moving average. Leading the index pack is the DJIA, with 21 of the Dow 30 above the 20-, 50-, 100-, and 200-day moving averages, just as the price-weighted index scaled 50,000 for the first time.
These three breadth tells — the SCTR, BPI, and moving-average views — will be critical to monitor this week. How cyclical and value equities react to key economic data sets the stage for the back half of the quarter. Recall that the S&P 500 was negative in each month from February through April last year, and we’ve seen bouts of March volatility in recent years.
Much of the heavy lifting so far has come from the smaller corners of the market, like Energy and Materials. Do they have more strength in their reserves? We might find out soon.
The Bottom Line
It has been a diversified investor’s dream. Tech stocks hit the pause button last October, domestic SMID caps took flight, and international equities powered higher into year-end 2025 and never looked back.
Last week’s bifurcation could not have been more stark. Software stocks were nearly in crash mode, the Mag 7 dropped to unchanged since September, all while the Dow closed the week at a record above 50,000. Traders must now monitor market breadth, as that is the driver of the current average-stock upswing.
Disclaimer: This blog is for educational purposes only and should not be construed as financial advice. The ideas and strategies should never be used without first assessing your own personal and financial situation, or without consulting a financial professional.


