The Dreaded Hindenburg Omen Fires Again

While some indicators in the technical analysis toolkit are designed to signal quite often, the Hindenburg Omen quite rarely flares up with a bearish reading. In fact, the indicator has only experienced a confirmed bearish signal eight times in the last ten years! But I’ve learned it can be a costly mistake to ignore macro technical signals like the Hindenburg, as their rare signals often precede painful market corrections.
Today, I’ll break down the components of the Hindenburg Omen, review the previous confirmed signals we’ve experienced back to 2016, and discuss what this could mean for the S&P 500 in Q4 2025.
Analyst Jim Miekka created the Hindenburg Omen back in the 1980s after he analyzed a bunch of previous major market tops. He found that some consistent features tended to appear toward the end of the bull market phase. Let’s break them down one by one.
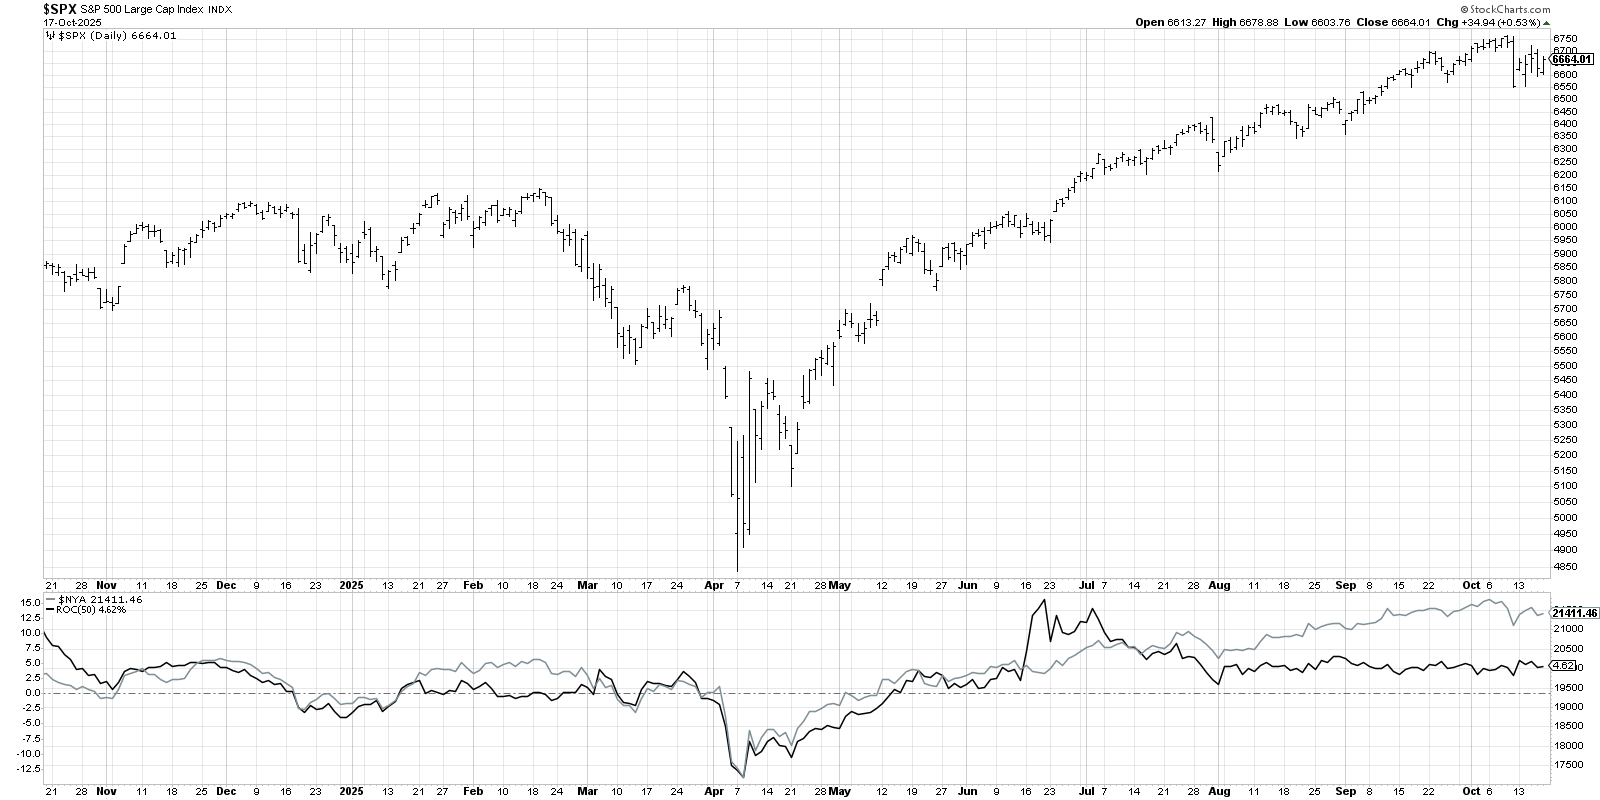
First of all, the market needs to be in an uptrend. Here, we’re showing the NYSE Composite Index ($NYA) in gray, along with the 50-day rate-of-change indicator in black. As long as that 50-day ROC is positive, then this first factor is triggered.
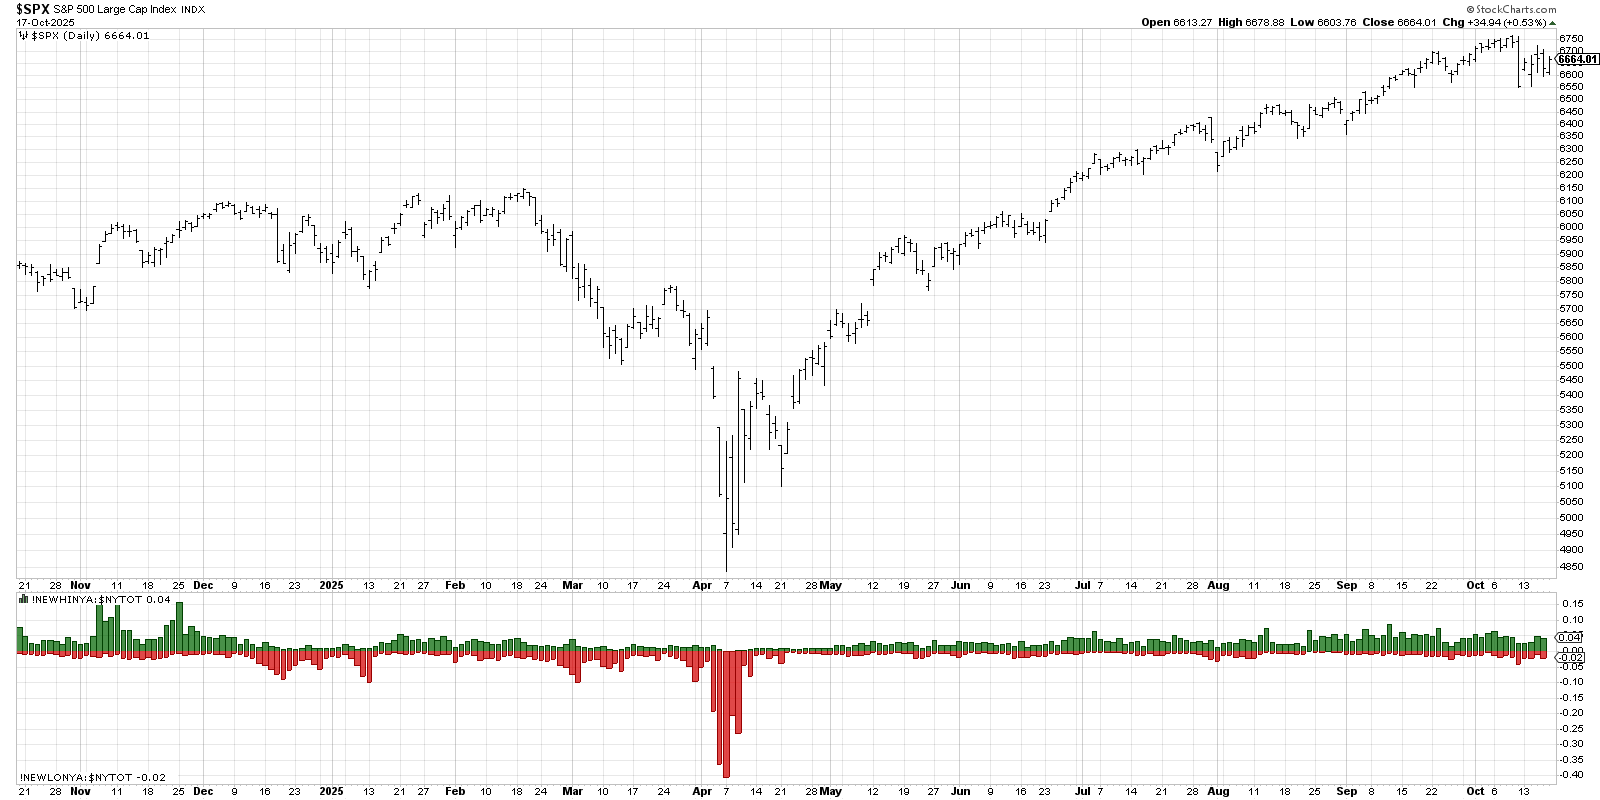
Next, we need there to be indecision in the equity markets, as measured by stocks making new highs and new lows. Specifically, we’re looking for at least 2.5% of the NYSE listings to make a new 52-week high, and also over 2.5% of the NYSE to make a new 52-week low. And the key is that this needs to happen on the same day!
Having watched this indicator for many years, I will tell you this is often the factor that does not get triggered. On last Friday’s selloff, however, there were finally enough new lows and new highs to check this box.
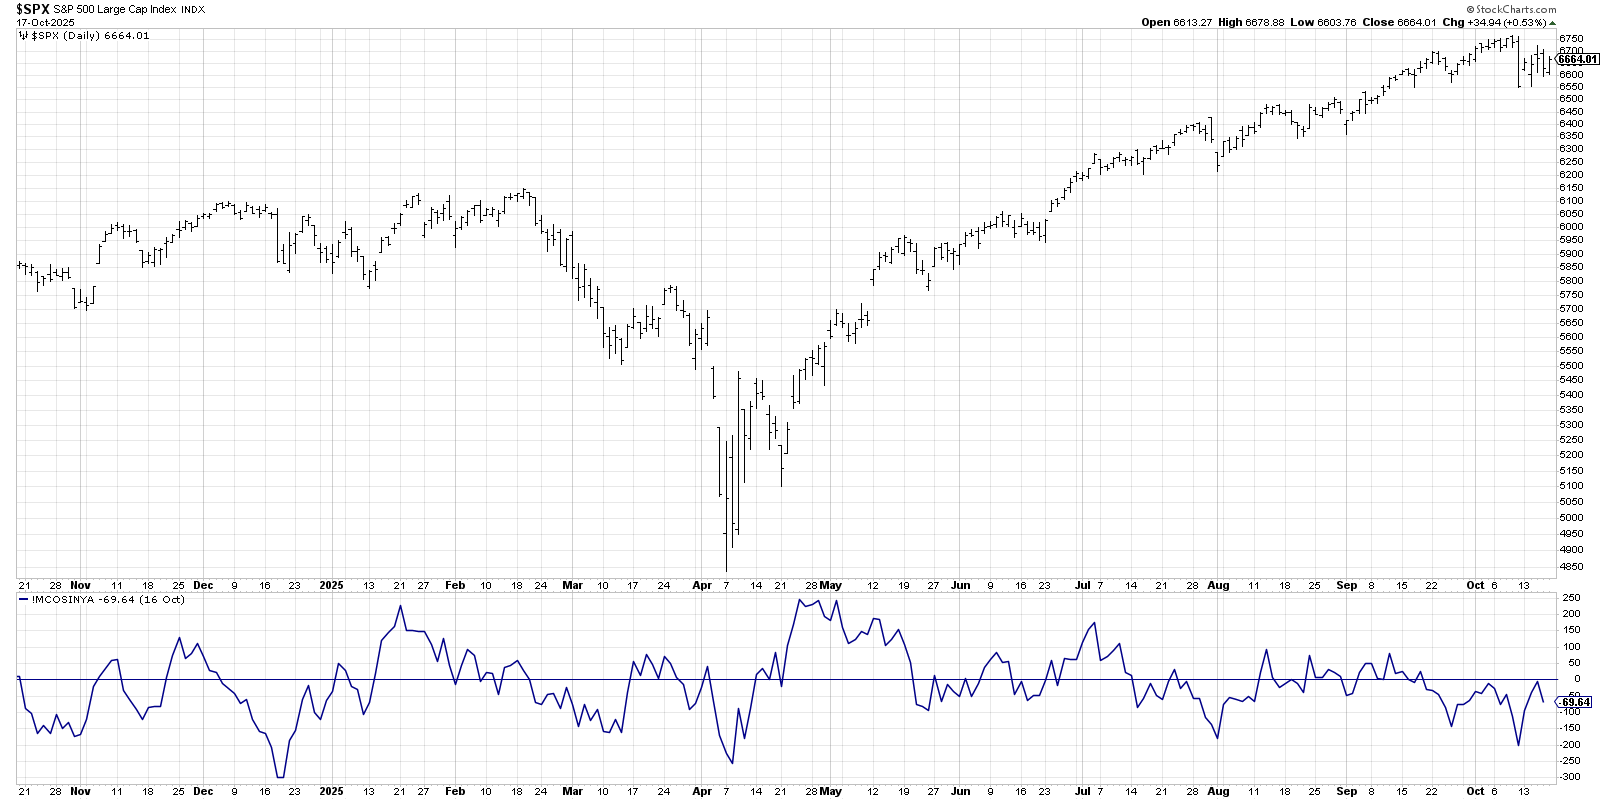
Finally, the breadth needs to turn negative, implying that there are problems “underneath the surface” as plenty of individual names are showing price weakness. If the McClellan Oscillator is below zero, then this factor is triggered. In fact, the McClellan Oscillator has been in this bearish configuration for almost a month!
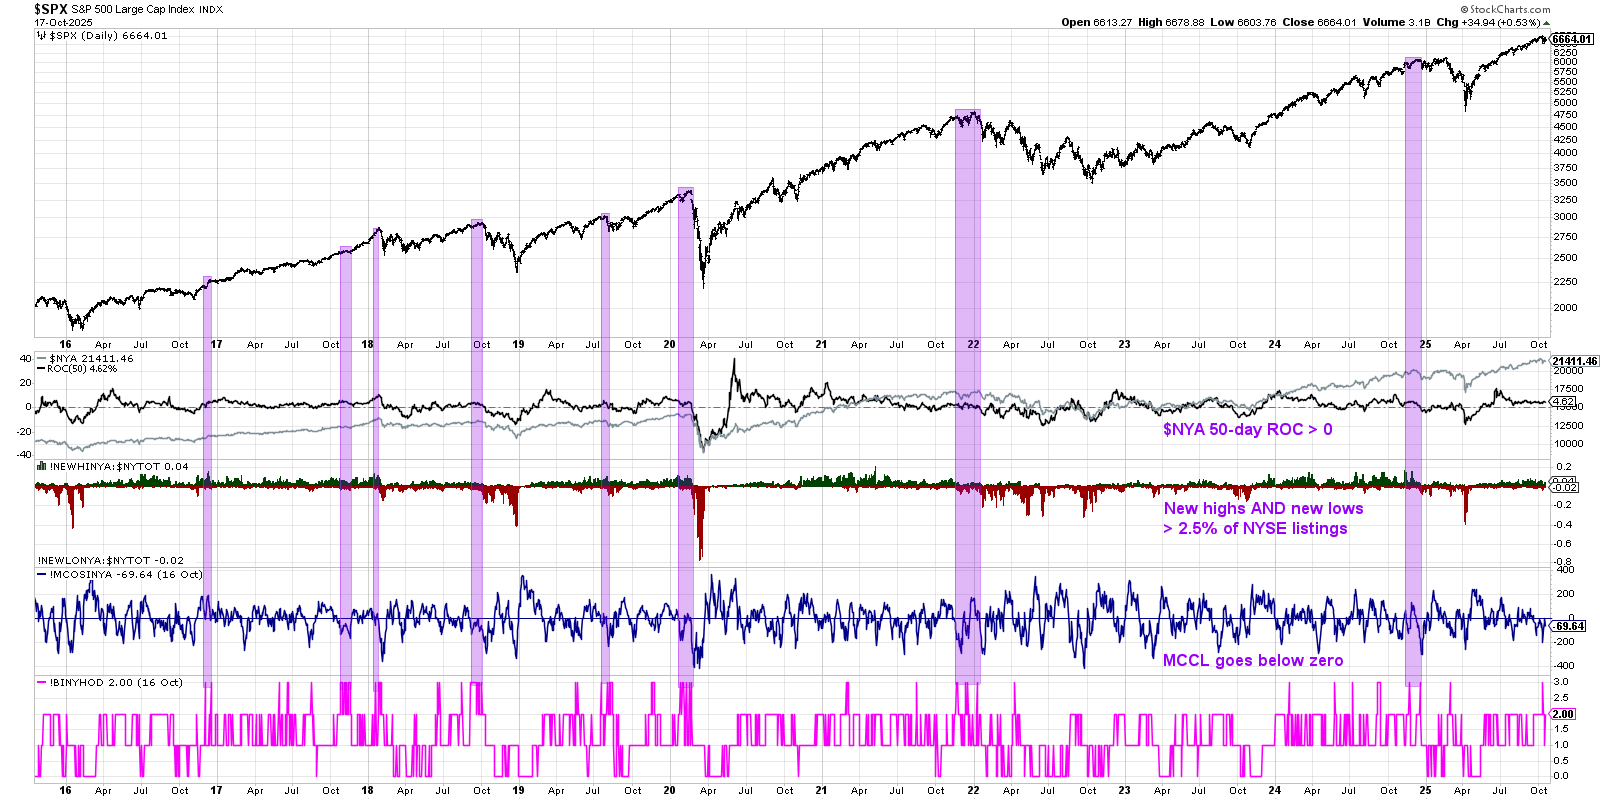
StockCharts provides a “composite” indicator that tracks the three individual factors. If all three are triggered, as we experienced last Friday, then the indicator shows a value of +3.
The most important part of the indicator is that those three factors outlined above need to be triggered twice within one month, or about 20 trading days. If and when that would occur, then we have a confirmed Hindenburg Omen sell signal.
Looking back over the last ten years, we can see that there have been eight valid and confirmed bearish signals. The last six signals have been followed soon after by meaningful corrections for the S&P 500 and Nasdaq 100. The signals in 2016 and 2017, while successfully meeting all the requirements for the Hindenburg Omen, did not result in any significant drawdowns.
Back to the current market environment, we've highlighted deteriorating momentum and breadth conditions recently on our daily market recap show. We've also noted rotations into defensive sectors like utilities, spikes in volatility, and other signs that suggest that the Fear of Missing Out (FOMO) may be transitioning to a Fear of Losing Everything (FOLE).
While the S&P 500 finished this week above our short-term "line in the sand" around 6550, the evidence seems to be forming for a major corrective move in Q4 2025. And while the current Hindenburg Omen has not yet been confirmed with a second signal, we're definitely developing a strategy for navigating a pullback phase in the coming weeks.
I interviewed Adam Koos recently on the Market Misbehavior podcast, and he equated bearish omens like this to tornado sirens that are found around the Midwest. Just because the tornado siren goes off one day doesn't guarantee that your neighborhood is going to be ravaged by a natural disaster. But when I hear a tornado siren, I’m definitely still going to go down in the basement!
RR#6,
Dave
P.S. Ready to upgrade your investment process? Check out my free behavioral investing course!
David Keller, CMT
President and Chief Strategist
Sierra Alpha Research
marketmisbehavior.com
Disclaimer: This blog is for educational purposes only and should not be construed as financial advice. The ideas and strategies should never be used without first assessing your own personal and financial situation, or without consulting a financial professional.
The author does not have a position in mentioned securities at the time of publication. Any opinions expressed herein are solely those of the author and do not in any way represent the views or opinions of any other person or entity.


