A Few Stocks Are Driving the Market Higher — Should You Be Concerned?

Key Takeaways
- While the major stock market indexes keep hitting new highs, most of the gains are coming from a small group of mega-cap tech stocks.
- Less than half of S&P 500 stocks are trading above their 50-day moving average.
- Between big tech earnings, a Fed meeting, and the Trump–Xi discussion, this week is packed with market-moving events.
The stock market just can’t stop making new highs! It makes it look like everything’s rosy and there’s not much to worry about – but is that realistic? Let’s take a closer look because, as you know, the market is capable of surprising you when you least expect it.
We’ve seen three consecutive gap-up days in the S&P 500 ($SPX), Nasdaq Composite ($COMPQ), and the Dow Jones Industrial Average ($INDU). That’s a strong move and something certainly worth monitoring.
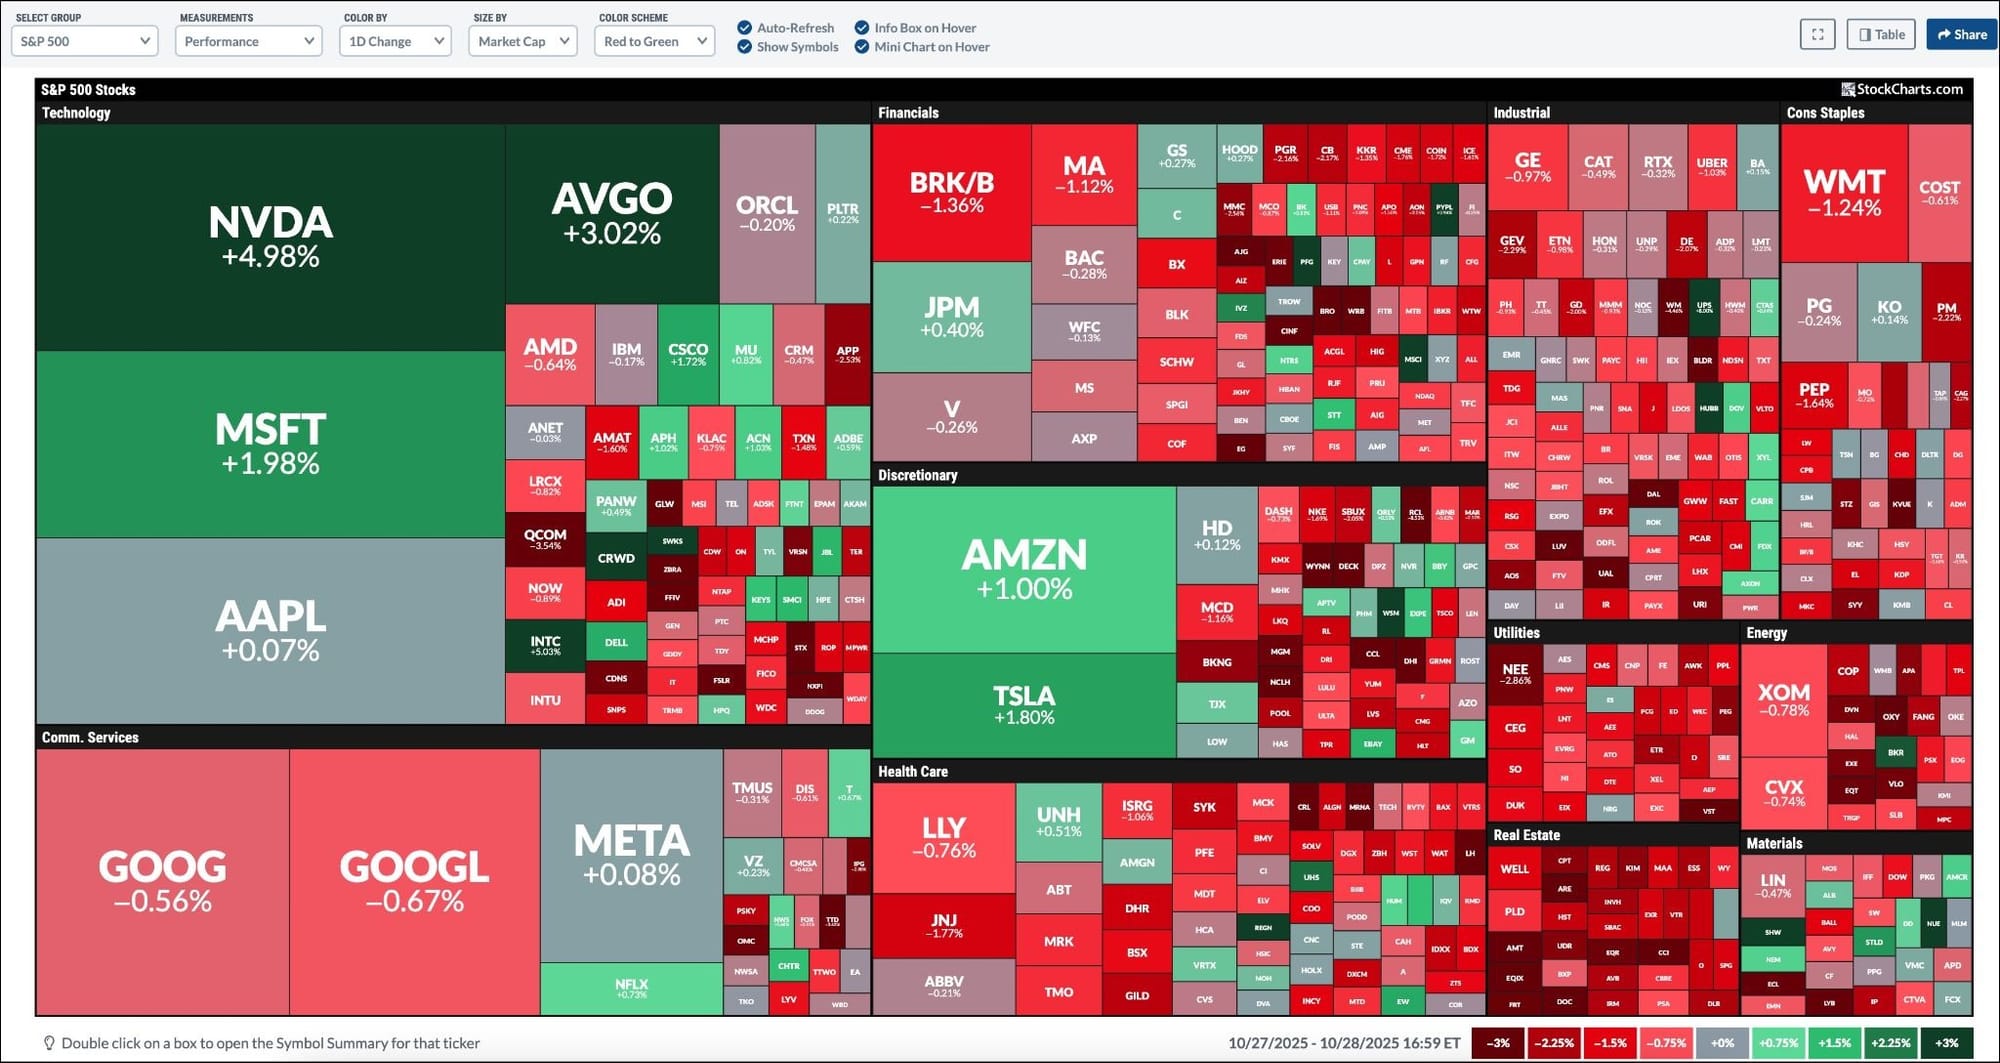
Here’s where it gets interesting, though. On Tuesday, only three S&P 500 sectors closed in the green — Technology, Materials, and Consumer Discretionary. Materials and Consumer Discretionary were just marginally higher. In short, a small group of stocks is doing the bulk of the work.
The StockCharts MarketCarpet for the S&P 500 below shows that the top stock movers were NVIDIA (NVDA), Broadcom (AVGO), Microsoft (MSFT), Amazon (AMZN), and Tesla (TSLA). Outside of Technology and Consumer Discretionary, there’s a lot more red than green.
What Market Breadth is Telling Us
When just a handful of stocks are driving the market higher, it’s a good idea to check on the rest of the market. One way to do that is to compare the S&P 500 Equal Weighted Index ($SPXEW) to the S&P 500. The chart below displays $SPXEW as closed candlesticks, and the S&P 500 as a solid black line.
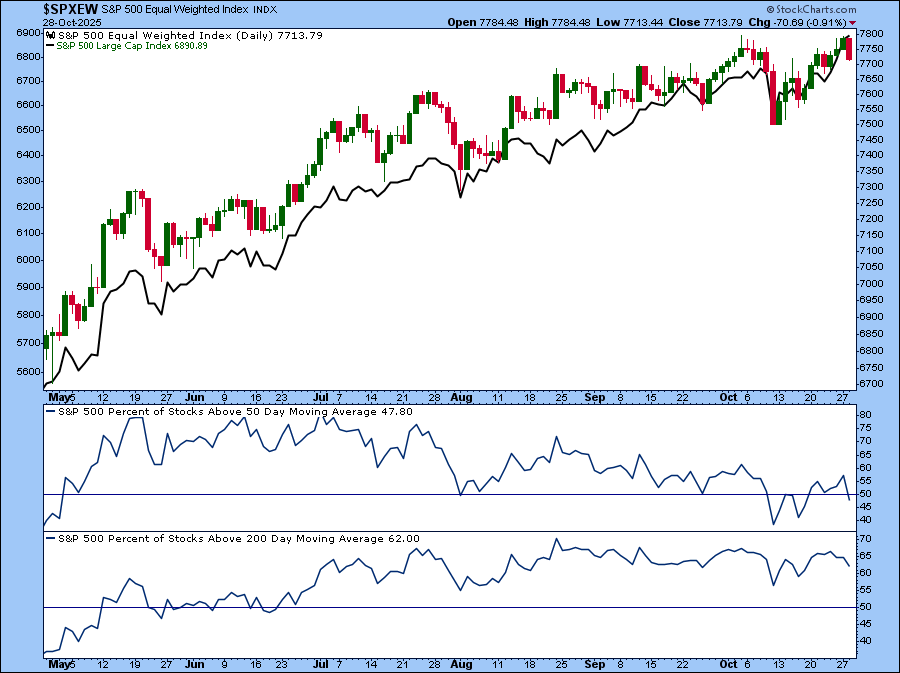
On Tuesday, the S&P 500 gained 0.23%, but the equal-weighted version fell 0.91%. This divergence is a reminder that not all stocks are joining the party.
Note that less than half of the S&P 500 stocks are now trading above the 50-day simple moving average (SMA). The good news is that more than half are still above their 200-day SMA. Right now, there’s no need to panic, but it’s worth keeping an eye on this data. They can tell you whether this rally is being powered by a few big names or by a broader group of stocks.
Why Is Tech in the Spotlight?
Part of the reason for the strength in tech stocks has to do with earnings. The big names, i.e., Apple (AAPL), Amazon (AMZN), Alphabet (GOOGL), Microsoft (MSFT), and Meta Platforms (META), are reporting this week. So far, Q3 earnings have been solid, and investors seem to expect more good news from the tech giants.
Once the earnings dust settles, we’ll see if the market broadens out.
What Else is On Deck for the Week
There are a couple of big events on the calendar. There’s the Fed meeting on Wednesday afternoon. The market has priced in a 25 basis point rate cut, but investors will be listening for what is likely to happen in the December meeting.
There’s also the Trump–Xi meeting on Thursday. Any headlines from that conversation could send the market moving.
This is a busy week, so keep tabs on what’s happening beneath the surface.
Here’s how to do that:
- Head over to the Market Summary page (available to StockCharts members).
- In the Breadth panel, select the Moving Averages tab.
- Click on an index to see how many stocks are trading above their key moving averages.
If you start seeing those percentages dip below 50 across the board, it may be a signal that a pullback is on the horizon. When a pullback occurs, you’ll have to look for signals that indicate how far the market will fall before reversing.
Until then, enjoy the ride, but stay alert!
Disclaimer: This blog is for educational purposes only and should not be construed as financial advice. The ideas and strategies should never be used without first assessing your own personal and financial situation, or without consulting a financial professional.


