Finance SPDR Takes a Hit, but Maintains Uptrend as Trading Setup Emerges

Key Takeaways
- XLF maintains its long-term uptrend (SMA and PPO).
- Bollinger Bands and %B Signal show oversold condition.
- Short-term resistance marks key levels to watch.
The Financial Select Sector SPDR Fund (XLF) was hit hard the last few weeks, but remains in an uptrend overall. In fact, the ETF is oversold within this uptrend. More importantly, oversold conditions present traders with opportunities to trade in the direction of the bigger trend. There are three steps in this process: determine the long-term trend, identify oversold conditions, and set key levels to signal a breakout.
Today's report will cover the setup in XLF.
Ensure a Long-term Uptrend
The first chart shows XLF with candlesticks, the 200-day Simple Moving Average or SMA (gray line), and the Percentage Price Oscillator or PPO(5,200,0). XLF is in a long-term uptrend, with a new high in early January and price above the rising 200-day SMA.
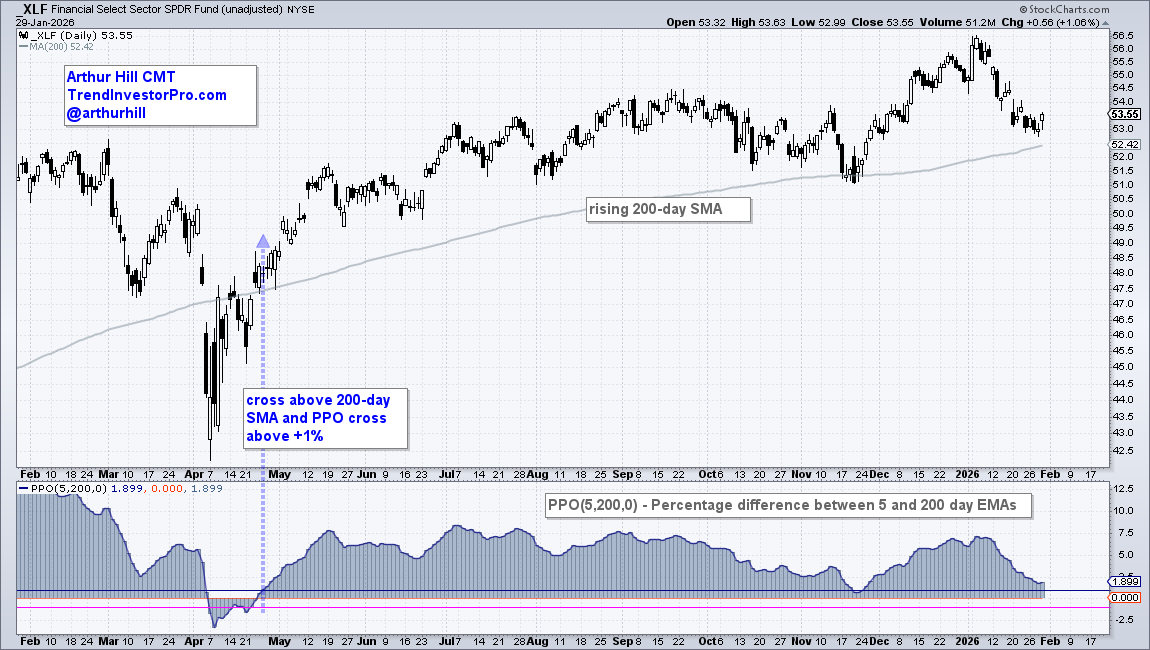
The bottom window shows the PPO(5,200,0), which is the percentage difference between the 5- and 200-day EMAs. I added signal lines at +1% and -1% to reduce whipsaws. A cross above +1% signals an uptrend, while a cross below -1% triggers a downtrend. This indicator signals uptrend right now.
Bollinger Bands to Identify Oversold Conditions
With an uptrend underway, it is time to wait for oversold conditions and/or tradable patterns.
The next chart shows XLF with Bollinger Bands (20,2) on the price chart and %B (20,2) in the indicator window. %B measures the distance of the close relative to the upper and lower Bollinger Bands. A value below zero occurs when the close is below the lower Bollinger Band, which signals a short-term oversold condition. This means the close is more than 2 standard deviations below the 20-day SMA, which is the middle line on the Bollinger Bands.
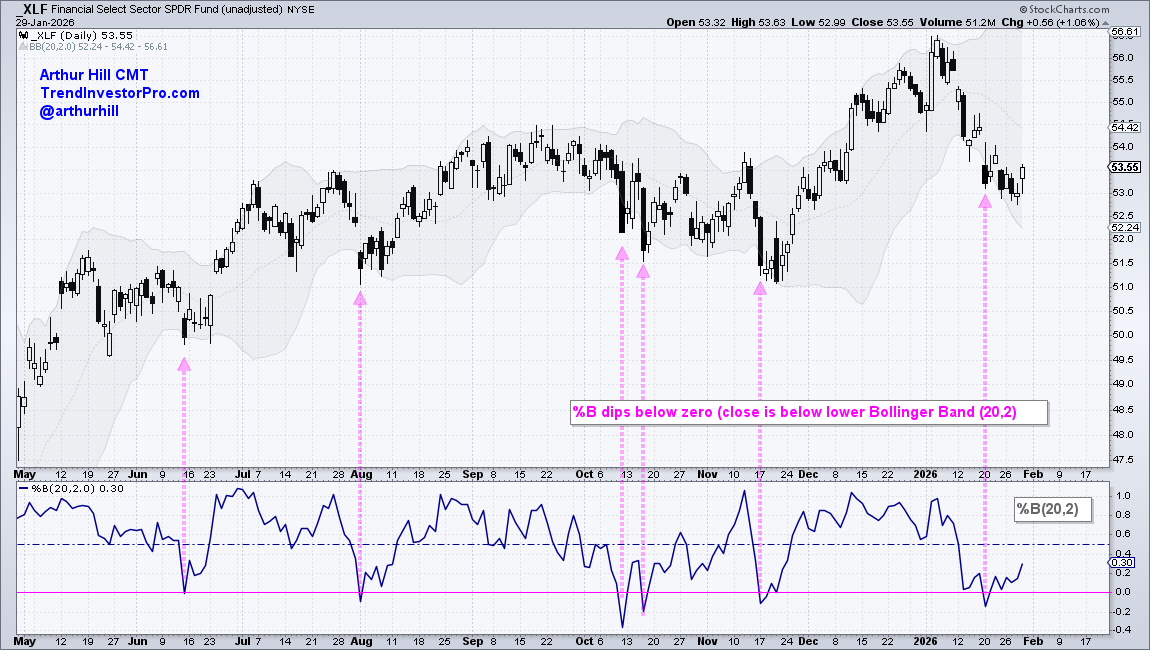
The pink arrows show oversold conditions since May. XLF bounced after oversold conditions in mid June, late July, and mid-November. The ETF did not bounce much in October as it continued lower into mid-November. Not every oversold condition leads to a bounce; TrendInvestorPro specializes in finding short-term oversold conditions within uptrends for stocks and ETFs.
Recent reports and videos at TrendInvestorPro:
- SPY, QQQ, and XLK Hold the Line (Key Levels to Watch)
- Fastenal Turns Leader and GE Becomes Oversold
- A Bullish Setup for the 7-10Yr TBond ETF
- Bitcoin ETF Forms Bearish Continuation Pattern
Click here to take a trial and gain full access.
Look for a Short-term Upside Catalyst
There is a big challenge with oversold conditions: namely, ETFs and stocks can become oversold and remain oversold (continue falling). We need a method to determine that the short-term decline is reversing and the long-term uptrend is resuming. To do this, traders can use candlestick patterns, a short-term PPO, or price action.
The chart below shows tradable patterns forming in June and early November (triangles). XLF broke out in late June and moved to new highs in July. The ETF also broke out in early November, but this breakout did not hold as price fell below the October low. Setups sometimes fail. Be prepared.
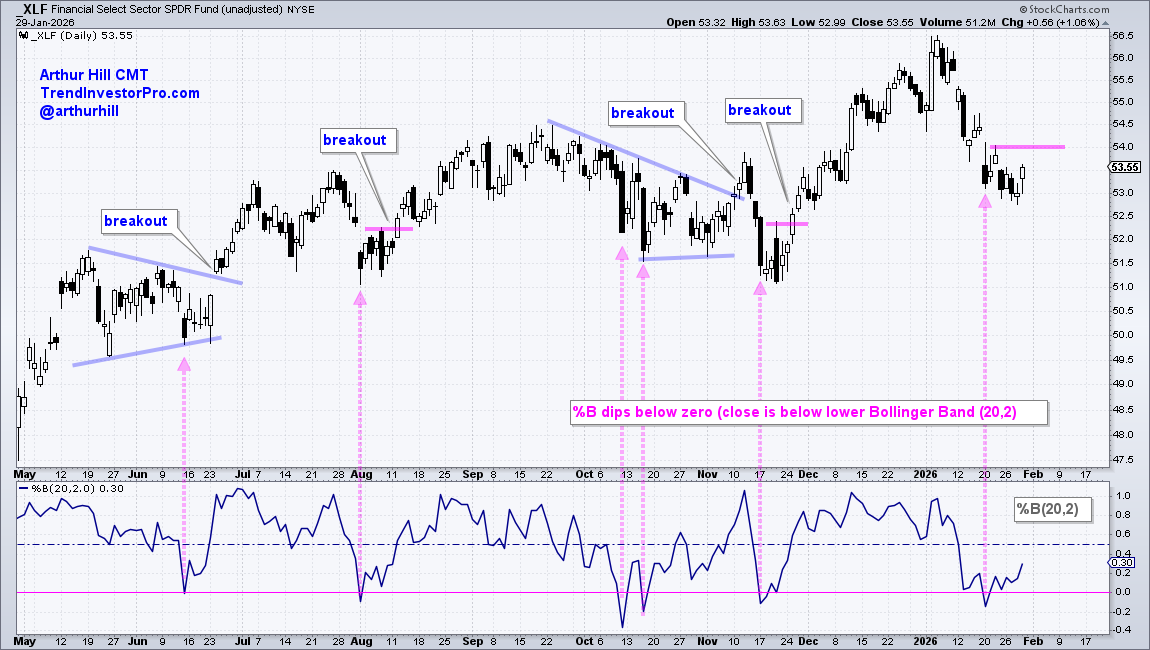
Even though XLF did not form clear patterns in August and mid-November, the ETF became oversold and established short-term resistance levels to monitor for breakouts. XLF broke out each time and moved to new highs shortly thereafter.
This brings us to the current situation. XLF is oversold within an uptrend and the ETF established a short-term resistance level at 54. A breakout here would reverse the short-term slide and argue for a move higher.
Keep in mind that not all setups work. Therefore, we must plan our trade ahead of time and then trade according to that plan.
See TrendInvestorPro for more reports and videos.


