A Four Point Plan Using Market Analysis, PPO, and CCI to Find Robust Entry Points

Key Takeaways
- If you're interested in building a position in an industry group ETF, this four-point plan is an objective method to find attractive entry points.
- The process involves ensuring a bull market is in play, the ETF is in an uptrend, identifying a pullback with the CCI, and identifying a bullish continuation pattern breakout.
- Follow the step-by-step process of the four-point plan via a detailed example.
Chartists interested in building a position in a particular industry group ETF should consider this four-point plan to find attractive entry points. First, the broad market environment should be bullish (bull market). Second, the name should be in a long-term uptrend. Once these conditions are met, chartists can use the Commodity Channel Index (CCI) to identify pullbacks within the uptrend and chart patterns to signal a continuation of the uptrend.
Today's report will show a detailed example using the First Trust NASDAQ Cybersecurity ETF (CIBR).
Weigh Evidence Using SPY and Breadth
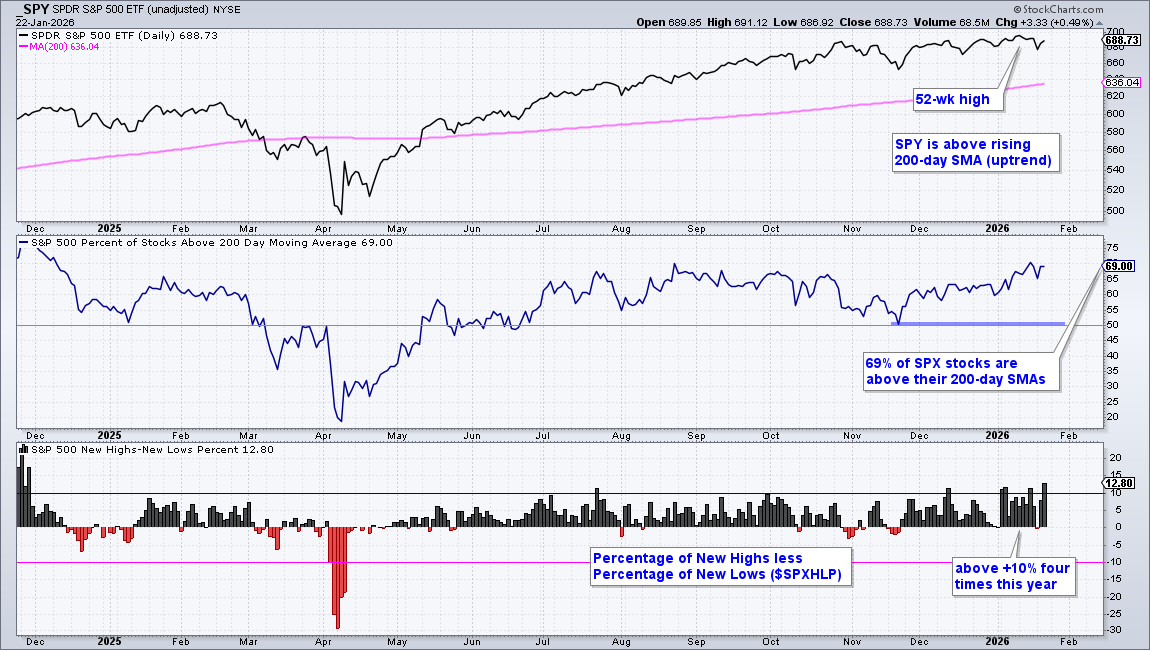
To begin, stocks should be in a bull market. Currently, the weight of the evidence is bullish for stocks. First, SPY is in a long-term uptrend because it hit a new high in early December and remains above its rising 200-day SMA. Second, over 65% of S&P 500 stocks are above their 200-day SMAs and in long-term uptrends. Third, the percentage of new highs expanded in 2026 as High-Low Percent exceeded +10% four times already this year.
Define Long-term Uptrend With PPO
Next, the ETF should be in an uptrend. To define the trend, chartists can use basic price analysis and trendlines. The chart below shows weekly candlesticks for CIBR, which is in a long-term uptrend with a series of higher highs and higher lows; the blue trendlines show a rising channel.
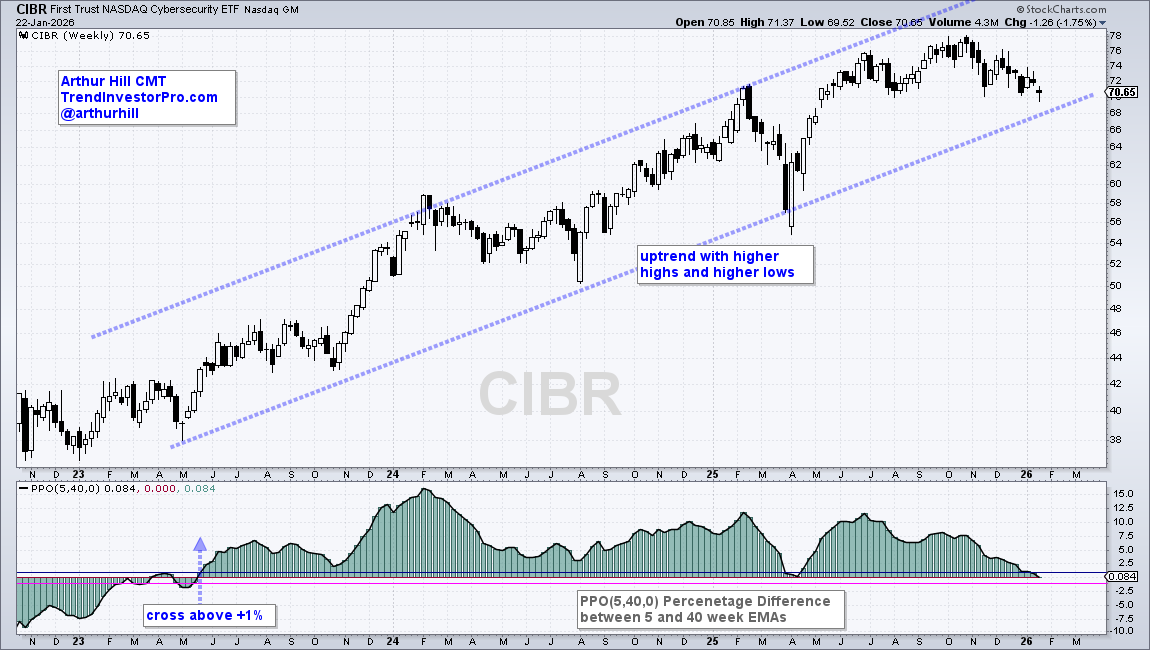
In the indicator window, the PPO(5,40,0) shows an uptrend since the break above +1% in May 2023. This indicator measures the percentage difference between the 5 and 40 week EMAs. It is positive when the 5-week EMA is above the 40-week EMA. I added signal thresholds at +1% and -1% to reduce whipsaws. A move below -1% (pink line) would signal a downtrend.
Identify Oversold Conditions Using CCI
Once the long-term uptrend is established, chartists can use oversold conditions to help time entry points within that uptrend. The next chart shows the Commodity Channel Index (20) in the middle window. This is a momentum oscillator that becomes oversold with a move below -100. Oversold conditions are typically present after a pullback, and a pullback within an uptrend is an opportunity. The pink arrow lines show when CCI dips below -100.
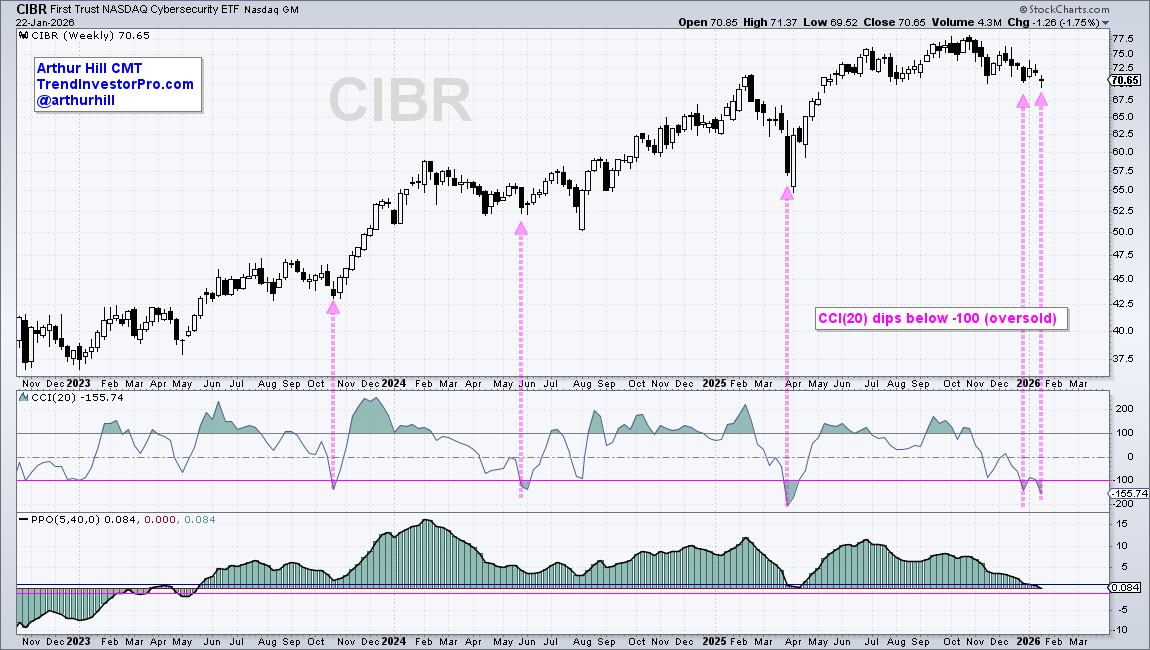
Keep in mind that I am using weekly charts, so don't expect frequent oversold readings. In fact, there were oversold readings in October 2023, May 2024, March 2025, December 2025, and January 2026. That's only around one and a half per year. Chartists looking for more frequent signals turn to the daily chart. Note that TrendInvestorPro specializes in finding oversold setups and tradable pullbacks within an uptrend.
Recent reports and videos at TrendInvestorPro:
- Forget the News and Focus on the Charts
- Utilities SPDR Bids to End Correction
- Two Semiconductor Stocks with Bullish Setups
- Silver Goes Parabolic with Signs of a Blowoff Top
Click here to take a trial and gain full access.
Set a Breakout Level Using a Bullish Pattern
The last step is to identify a breakout level using a bullish continuation pattern. The next chart shows CIBR with four tradable patterns since the second half of 2023. Bullish continuation patterns define pullbacks or consolidations within uptrends. Subsequent breakouts signal an end to the correction and a continuation of the uptrend. A triangle formed into October 2023, and CIBR broke out in early November. A wedge formed into June 2024, and CIBR broke out that same month. A steep falling channel formed into April 2025, and the ETF broke out in mid-April.
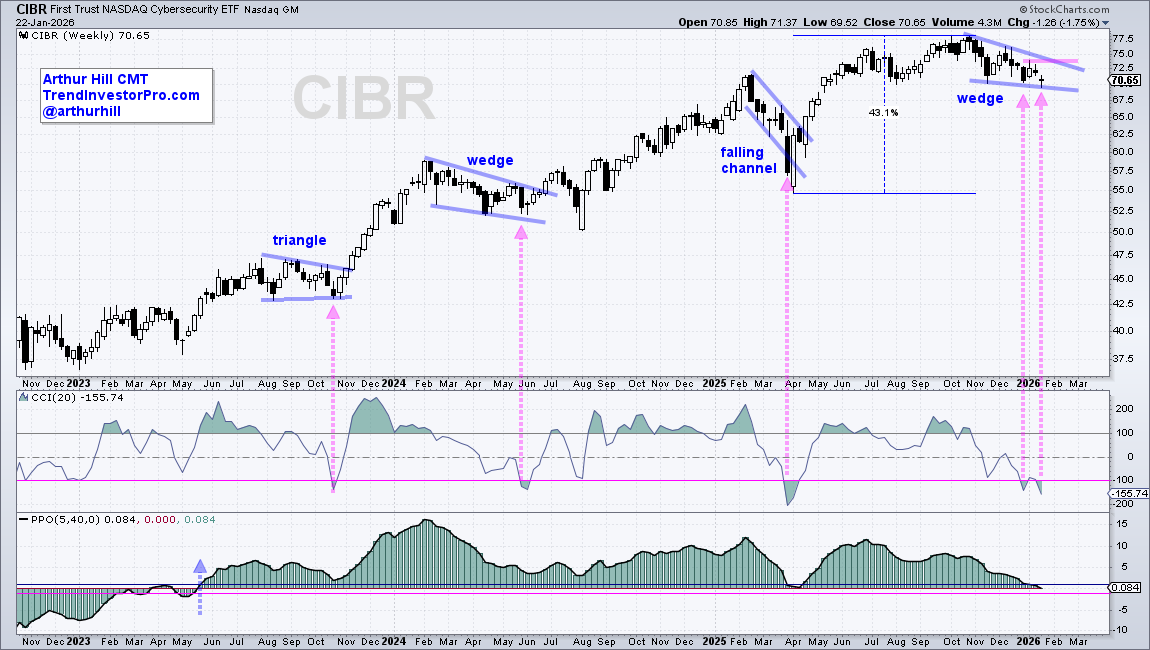
Of note, a falling wedge has formed as CIBR fell over the last three months. This is a correction after the 43% surge from April to October. A pullback or rest is perfectly normal after a big advance.
I am marking wedge resistance at 74. A breakout here would signal an end to the corrective period and a resumption of the uptrend.
Note that aggressive investors can consider buying on the oversold condition. The assumption here is that the long-term uptrend is the dominant force and it will take over at some point. The trouble starts when a bear market signals or a long-term downtrend signals. As long as there is a bull market and long-term uptrend, we should be looking for tradable pullbacks.


