From Trash to Treasure: Micro-Caps Lead the Market’s Risk-On Rebound

Key Takeaways
- Junky micro-caps have been on a tear since the April low, and investors are just beginning to take notice
- Volume trends are key to the rally, as IWC eyes an all-time weekly high close
- Investors must consider the chance of a powerful chase-for-performance rally toward year-end
There’s a lot of bubble talk out there. Earlier this week, Bank of America released its monthly Global Fund Manager Survey; its poll revealed that 60% of portfolio managers believe global stocks are “overvalued.” At the same time, Google Trends search data shows a spike in queries mentioning both “tech” and “bubble.”
It’s all music to bulls’ ears. After all, markets are wont to climb walls of worry, and doubt is the rocket fuel that lifts risky assets to new highs. Look no further than the apparent barbell trade ongoing for the past six months: Global semiconductor stocks (and the broader AI trade) have been red-hot, of course, but so too has the dash for trash.
Micro-Caps Break Out
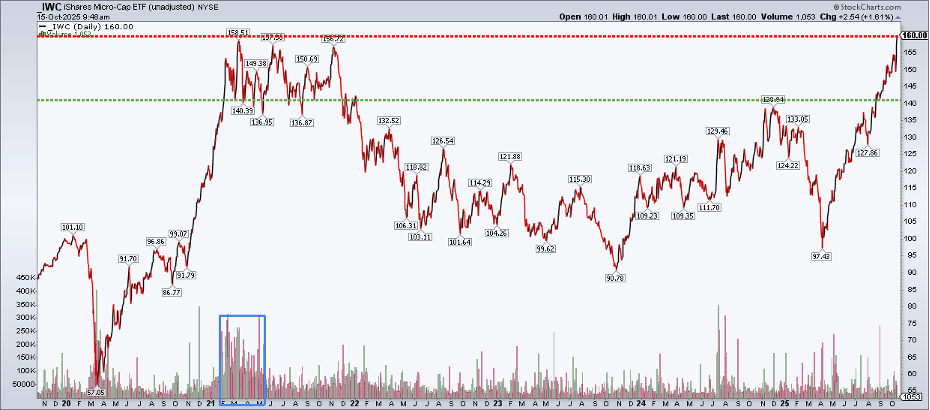
The iShares Micro-Cap ETF (IWC) has eyes on a record weekly close. Shares are up by more than 65% from the April low and now test the range peak from March to November 2021. Are micro-caps due for a pause? Or is the steep incline on the chart set to persist?
Lessons from the Gold Miners
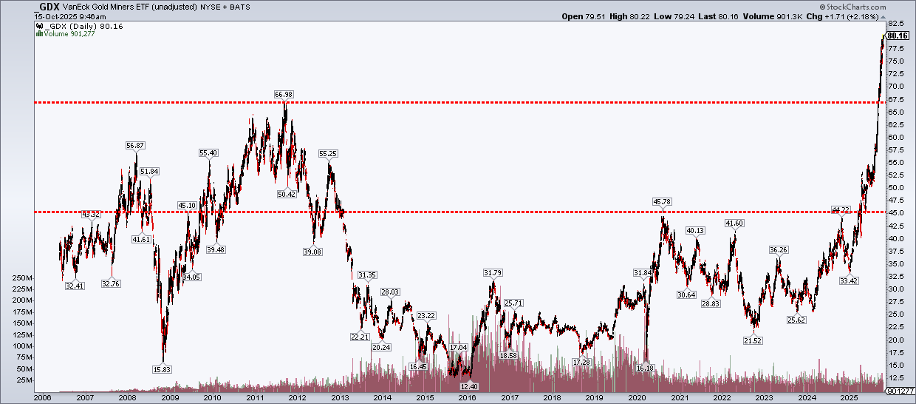
Typically, we should expect a consolidation at the past highs—a sort of wrapping around the zone that gave the bulls fits almost a half-decade ago. I’m reminded of GDX’s chart, though. I (incorrectly) asserted that the VanEck Gold Miners ETF would gather itself under $70 before the next leg up. Nope. GDX stormed through its 2011 previous all-time high, posting a fast 20% gain in barely more than a month.
Volume Tells the Story
Is similar price action on tap with IWC? It’s possible. Here’s why: What catches my attention on the micro-caps chart is not just price, but also what’s happening with its volume. Notice in the chart above that the incredible rally from November 2020 to the following March didn’t occur on a volume influx. Rather, a rise in the number of shares traded only came about once the ETF reached its price zenith.
From there, a classic distribution phase ensued. IWC oscillated between $135 and $159, in what was actually an unstable 15%-plus range. Once support at $135 was breached, the bears controlled the primary trend through October 2023 (12 months into the S&P 500 recovery). That bear market — March 2021 to early Q4 2023 — made U.S. small caps’ protracted decline look like a cakewalk.
And, unlike the S&P 500 (which is now in Year 4 of its bull market), IWC has endured intense volatility over the past two years. Indeed, it has not been a straight line. Volatility reached a crescendo in April, when domestic micro-caps plunged 32%. In hindsight, that was the final flush, and a nearly 70% ascent has played out.
If the 2021 playbook is a decent prologue, then IWC may keep running until volume rises materially. It’s that distribution phase that shareholders and risk-on bulls must be on guard for.
Seasonality and the Year-End Chase
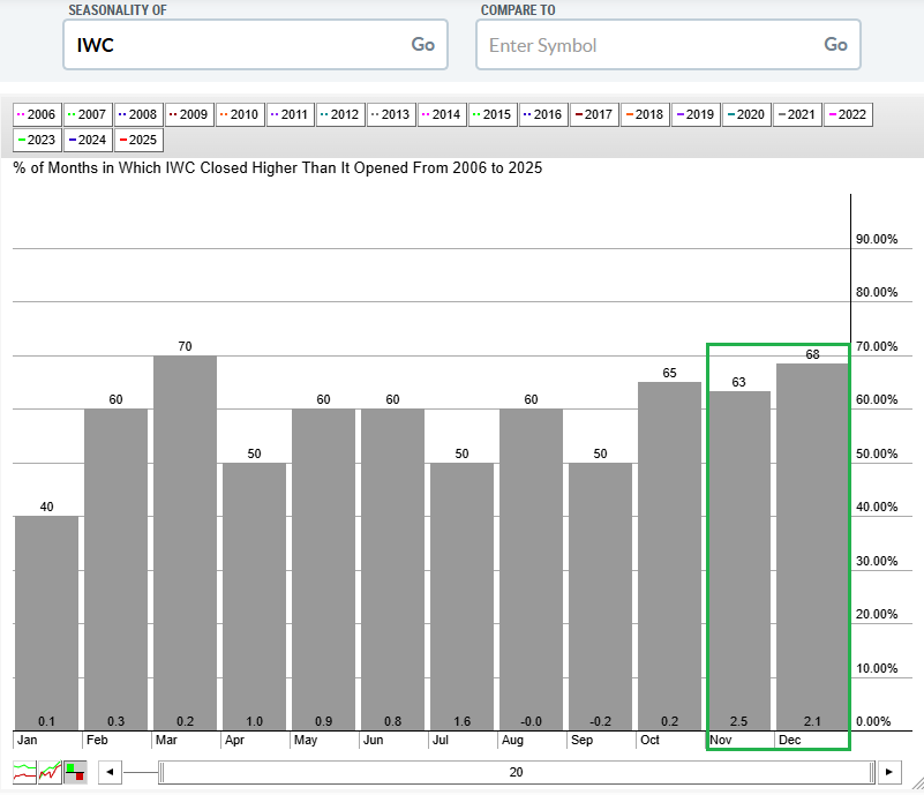
Seasonally, IWC tends to perform well into year-end. November and December are the best back-to-back months, with the fund up 63% of the time in November and 68% of all Decembers in data going back to 2006. Average monthly gains are 2.5% and 2.1%, respectively.
Also consider that we are in the heart of the “chase for performance” period. Most mutual funds close their books at the end of October, so a final grab for what has worked might very well unfold. Of course, IWC’s holdings are not exactly popular names among large active funds.
What’s Driving the Micro-Cap Rally?
Beyond price action, investors are surely curious to know what the fundamental drivers of IWC’s meteoric rise are. As Peter Lynch says, “Know what you own, and why you own it.” Peeking under its hood, the U.S. micro-cap investment mix shows a significant position in the Health Care sector. Like the iShares Russell 2000 ETF (IWM), biotech is an X-factor.
While Health Care is 24% of the product, Financials make up 19%. There, very small institutions — think community banks — command a sizable weight. Finally, Information Technology accounts for 18% of the ETF, and you can be sure that many AI darlings have helped IWC generate alpha since Q2.
Technical Tools for Tracking Micro-Caps
Whenever I’m analyzing the size factor, there’s one StockCharts tool that makes life easier.
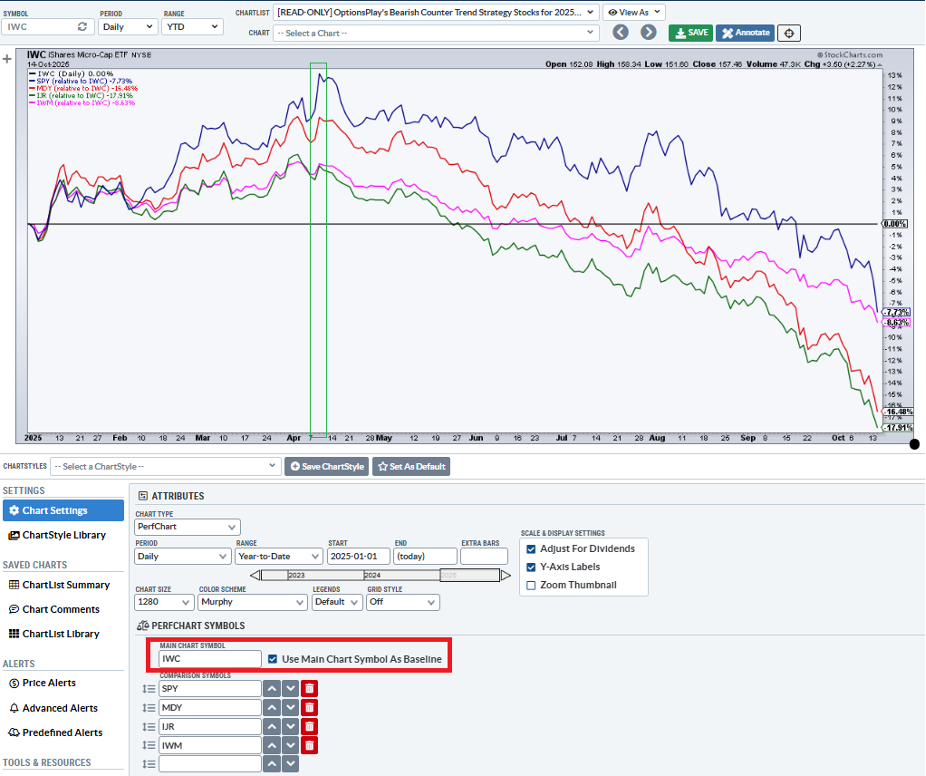
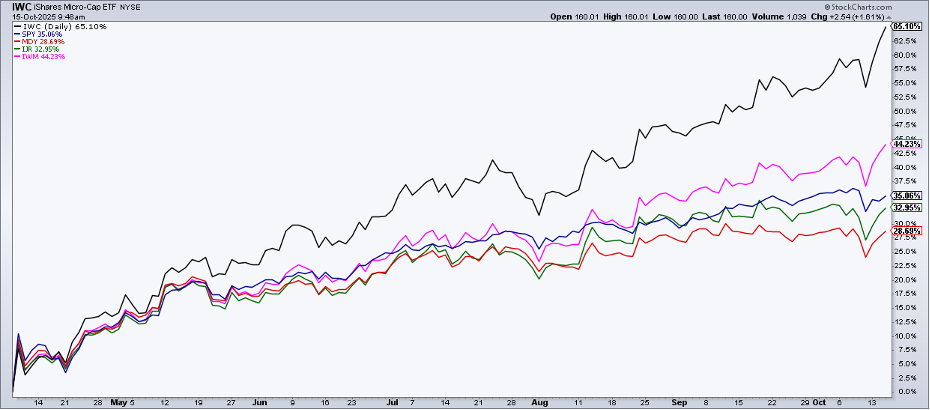
In SharpCharts, I set the Main Chart Symbol (IWC, in this case) as the baseline by checking the box under PERFCHART Symbols. Doing so here, I find that IWC’s outperformance began just when you would have expected — that is, on April 9.
Since then, the fund has returned 62%. That’s 20 percentage points of alpha over the red-hot IWM and 30 ppt better than the S&P 500 SPDR ETF (SPY). As I profiled earlier this week, high-quality U.S. mid-caps have lagged, up just 17% from the bottom.
Relative Strength Charting: Using the Baseline Feature
The Bottom Line
The junkier, the better. That has been the factor M.O. since the April low. Micro-cap returns trounce numbers from higher-quality SMID caps and make the S&P 500’s rally over the past six-plus months appear paltry. I’ll be watching IWC’s volume situation over the weeks ahead, potentially as a performance chase gets underway.
Disclaimer: This blog is for educational purposes only and should not be construed as financial advice. The ideas and strategies should never be used without first assessing your own personal and financial situation, or without consulting a financial professional.


