Gold's Big Breakout: $3,800 in Sight as Miners Lead the Charge

Key Takeaways
- Spot gold soared to an all-time high, above $3500, to jumpstart September.
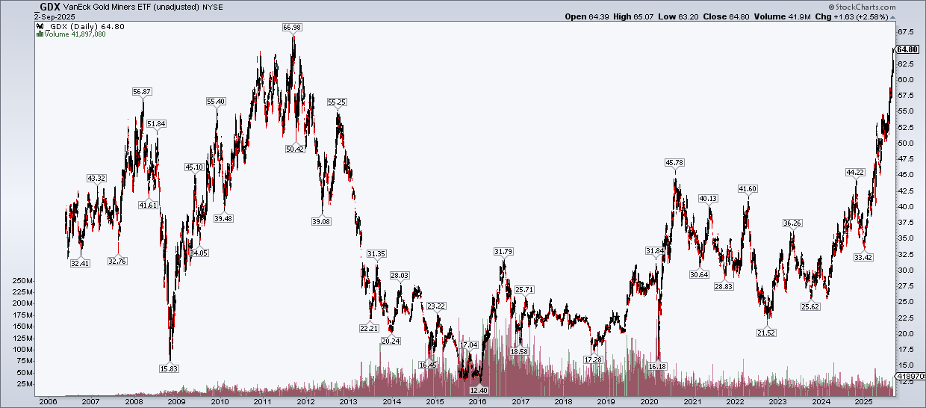
- GDX is now the most overbought since 2019.
- The gold miners’ ETF is within a few percent of its 2011 all-time high.
Big tech clawed back some of its recent losses on Wednesday, but gold is the star to begin September. The historically weak month for equities lived up to its billing as traders returned from the Labor Day weekend. Spiking 30-year sovereign bond yields around the world brought about the usual seasonal scaries, but traders must realize that it’s the second half of September that is more precarious for the S&P 500. The period from today through mid-month, by contrast, is often benign.
Gold's Rally: How Far Can the Breakout Run?
Bond vigilantes are up and about, and so are the gold bugs. Let’s zoom in on gold and where the precious metals space may go from here.
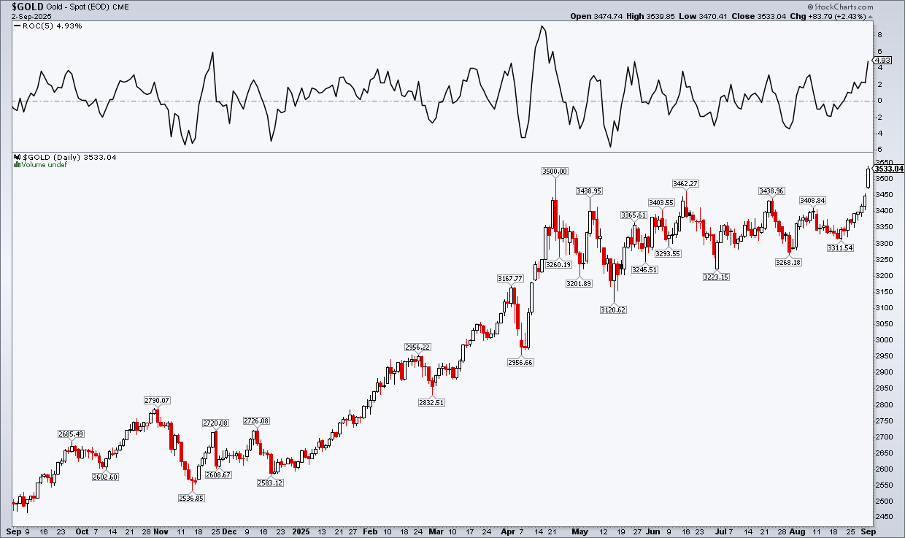
What struck me about the latest rise is how much the bulls appear to be in control. Heading into a string of key US jobs data points, the yellow metal is up five sessions running. The cumulative climb is 4.9% over that period (rate of change indicator applied to the chart below), matching the best such rally going back to late April. Furthermore, spot gold settled above its opening price each trading day, a reliable sign of stealthy strength.
Five Straight Days Higher: Strongest Gold Streak Since Spring
But let’s not bury the lede here. Where’s gold headed, at least according to the charts? The super-cycle graphs floating around out in the financial blogosphere augur for some fantastic price objectives, but I’m going to keep it short-term for swing traders today.
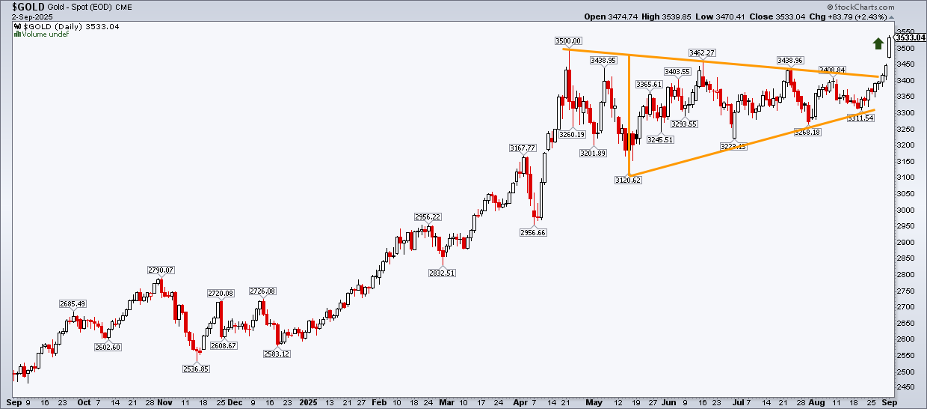
Notice in the daily gold chart below that the commodity consolidated from its April 22 intraday peak of $3500 through August 28. That more than four-month coil pattern offered a gauge of the next move’s magnitude. The height near the range’s beginning was $3480 down to $3120 ($360). Now, if we add that height onto the breakout point of $3420, the measured move upside price objective is near $3780. So, about 7% more upside with this advance is the presumption.
Gold: Symmetrical Triangle Breakout Targets Near $3800
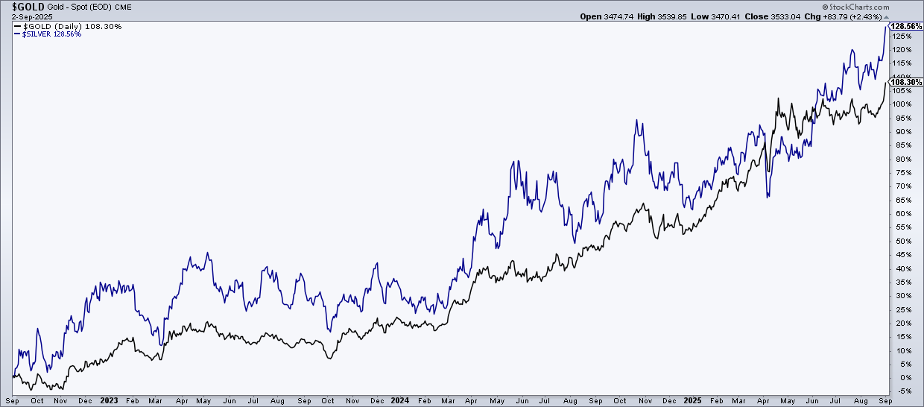
Broadening the view, both gold and silver are now up 41% over the past 12 months. Three-year returns are likewise impressive: +108% for gold, +129% for silver.
Gold and Silver's Remarkable Three-Year Surge
Miners Lead the Charge with Outsized Gains
Even better gains are seen among gold and silver miners, typically a higher-beta play on the precious metals. Two ETFs to watch are the VanEck Gold Miners ETF (GDX) and the Global X Silver Miners ETF (SIL). The pair of equity funds has produced, call it, 90% returns so far this year.
GDX and SIL are clearly on traders’ radars. Both attracted among the biggest single-day dollar-volume totals in the past five years on Tuesday.
Centering on GDX, the price-only chart has turned parabolic. With such a powerful climb, I ventured into the options arena to see its implied volatility. Perhaps surprisingly, it’s only in the mid-30% range, significantly below the 50%-plus readings in early April.
Why is that important? A modest implied volatility asserts that the rally has not gotten out of control. Anything could happen, of course (particularly this time of year), but, even though GDX’s year-to-date gain is historic, options traders don’t appear to be betting on a sudden crash or crescendo buying burst.
Do other indicators agree? Let’s take a look.
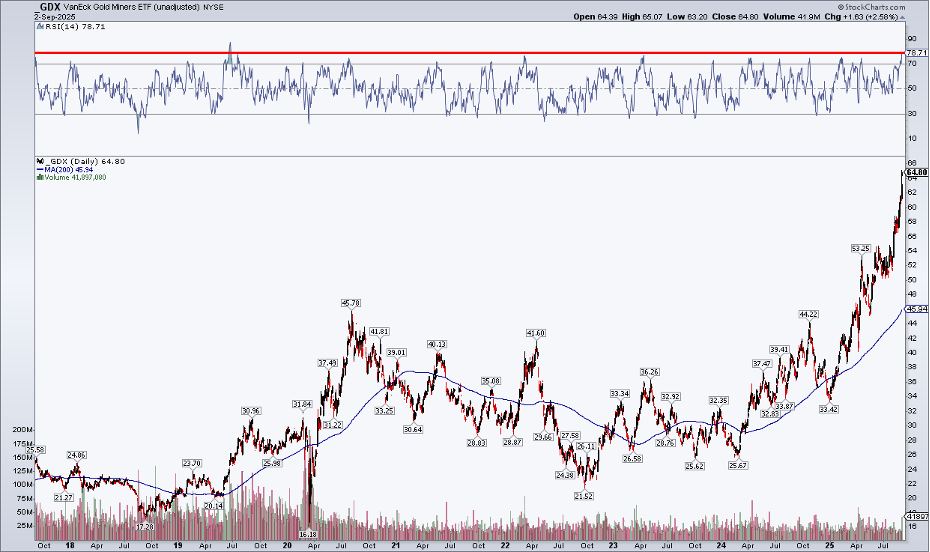
The Relative Strength Index (RSI) oscillator is a go-to momentum barometer. At 78, GDX is in technical overbought conditions. In fact, the 14-day RSI is at nosebleed levels on the multi-year chart; the current reading is the highest since July 2019.
Is now the time to harvest some gains on GDX? Perhaps. Along with tripling off its October 2022 low, the current price is 41% above its long-term 200-day moving average. We have to go back years to find such a gap between price and the 200-DMA (Q3 2020).
On the downside, the gold miners ETF has apparent support between $54 and $55, the range highs from April through July. With a 20% increase in the past five weeks, a retreat is certainly a possibility, particularly as we enter a period of major macroeconomic data points. The key September Fed decision is only two weeks away, as well.
GDX Overbought but Strong: RSI Hits Highest Level Since 2019
$66.98 is another historical price that bears watching. That was GDX’s all-time intraday high, notched amid the precious metal bull market almost precisely 14 years ago. Price has a long memory, and it would make sense to see GDX at least wrap around the all-time high before taking the next elevator ride up.
GDX Approaches 2011 Highs: Will Resistance Trigger a Pause?
A brief blurb on seasonality: According to StockCharts’ Seasonality view, gold, the commodity, has averaged a 0.6% September decline since 2006, up just 40% of the time. GDX has historically fared worse, with the same 40% positivity rate, but a -2.4% average September drop.
The Bottom Line
After four months of consolidation, gold broke out to new all-time highs to kick off September. Shares of gold mining companies rallied ahead of the metal’s breakout, logging a better-than 20% August advance. I see higher gold prices, but there’s technical evidence that GDX could cool off.
Disclaimer: This blog is for educational purposes only and should not be construed as financial advice. The ideas and strategies should never be used without first assessing your own personal and financial situation, or without consulting a financial professional.


