Gold Not Just Rallying, But Breaking Out All Over

Last week, I took a look at two indicators that have reliably triggered bear signals for gold in the last 50 years. I concluded that they were still bullish and that the ingredients for a parabolic extension were certainly in place. What’s especially compelling isn’t just gold’s broad-based strength, though; it’s the timing of it. That’s because gold is completing multi-year consolidation or reversal patterns when compared to several different asset classes, thereby setting the stage for some significant breakouts.
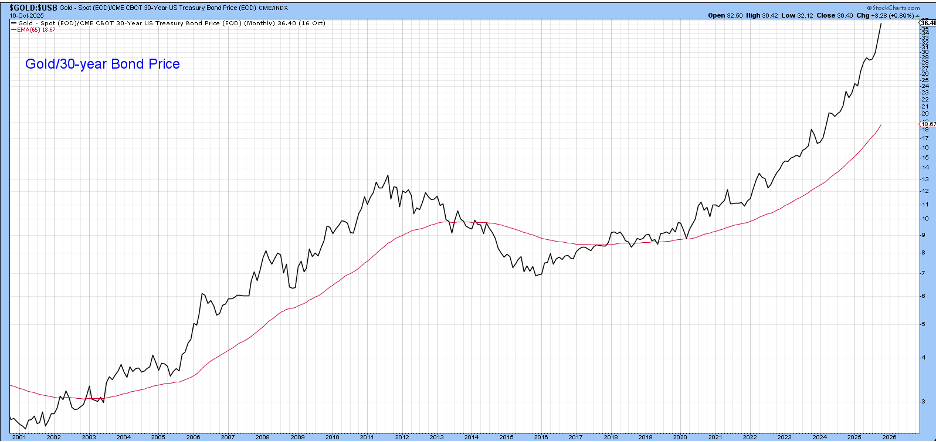
The bond market is not one of them, as Chart 1 shows the ratio between gold and 30-year Treasury bonds has been in a steep uptrend for some time.
Gold vs. Bitcoin
Gold has trailed Bitcoin — the top-performing asset since 2014 — but that dynamic may be shifting. Chart 2 shows the gold/Bitcoin ratio breaking above its long-term downtrend line from 2015 to 2025. Smoothed long-term momentum, as measured by the long-term KST, is beginning to turn upward as well.
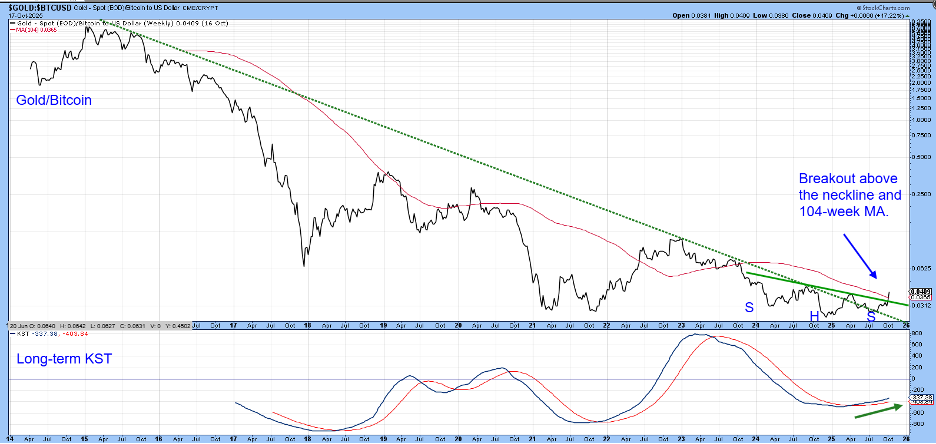
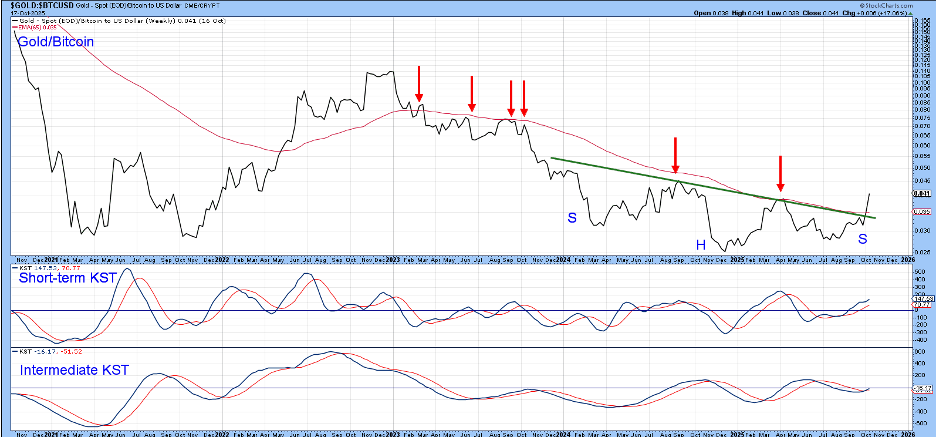
Chart 3 zooms in on the post-2021 price action, revealing a completed two-year inverse head-and-shoulders pattern. The neckline and trendline converge in the same region, reinforcing it as a key resistance zone. The downward-pointing red arrows highlight the 200-day EMA, which has rejected six bullish crossover attempts since early 2023. The latest breakout is not only decisive but is being supported by a bullish short- and intermediate-term KST.
Gold vs. Stocks
Chart 4 provides a historical view of the gold/stock ratio using the S&P Composite. It has experienced four major secular cycles since 1969. Each reversal was marked by a long-term trendline break and a crossover of the 96-month moving average. The MA crossovers may not always have been timely, but they did consistently signal secular shifts.
This relationship recently broke above its 1980–2025 solid green downtrend line. Some may question its construction because I ignored the false 2011–2012 breakout. However, the time spent temporarily above the line looks to me like an exhaustion phase of the post-2000 bull market. Consequently, it reinforces the trendline’s significance as a dynamic level of resistance because the ratio was unable to hold above it.
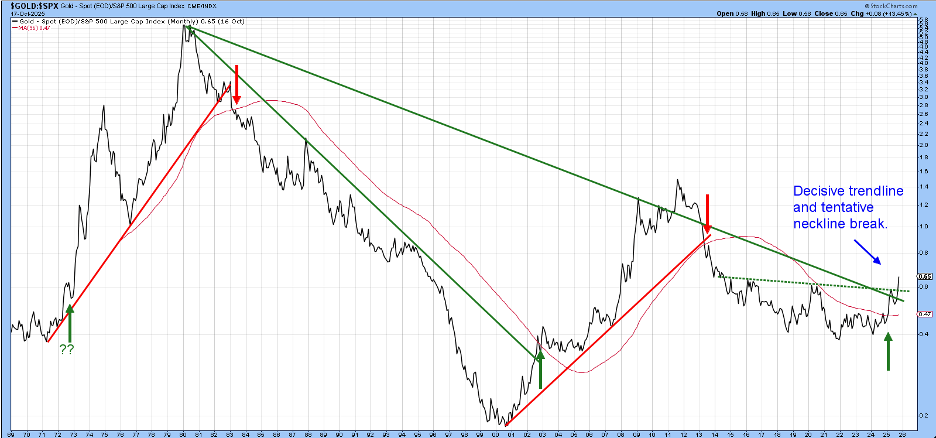
We can also see that the ratio has broken above the dashed trendline marking the top of a decade-long base. It has also moved decisively above its 96-month MA. While the breakout looks pretty solid, it’s important to remember this chart is based on monthly closes and October isn’t yet complete. Given the current high level of volatility in the gold market, it is not inconceivable, though highly unlikely, that the break will be invalidated in forthcoming sessions.
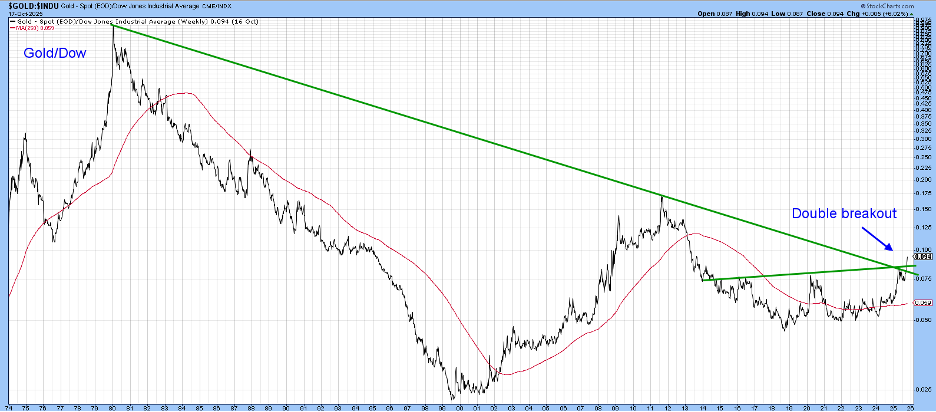
Nevertheless, Friday’s action did result in an equivalent breakout for the gold/Dow ratio in Chart 5. This weekly-based chart experienced a double break above both its secular downward trendline and the resistance trendline at the top of a 10-year base.
Gold vs Commodities
Gold is not breaking out against the CRB Composite. However, the ratio between them has just reached a new all-time high. The KST remains positive but is highly extended, suggesting a possible near-term reversal. In other words, gold’s superior performance relative to commodities may be entering its final phase for the cycle. Since momentum for gold generally moves ahead of that for commodities, such a transition of leadership to commodities would be a perfectly normal phenomenon.
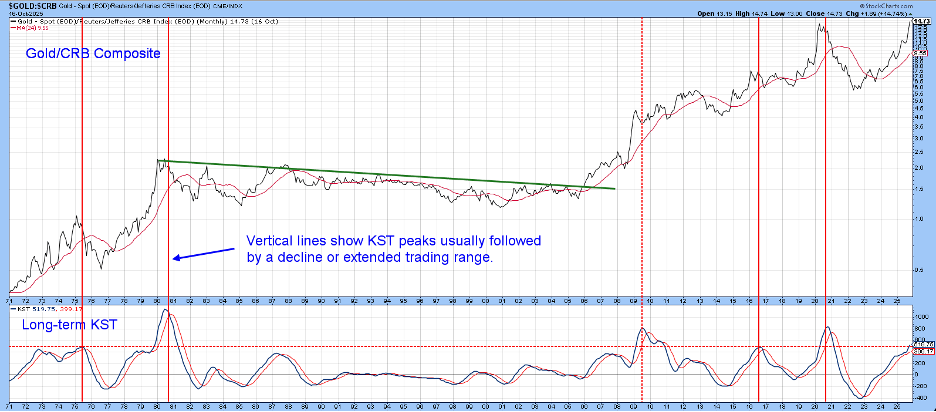
It’s worth noting the 2006 breakout from a 26-year consolidation, which led to a massive rally. That episode underscores how powerful a decisive move from a multi-year base can be.
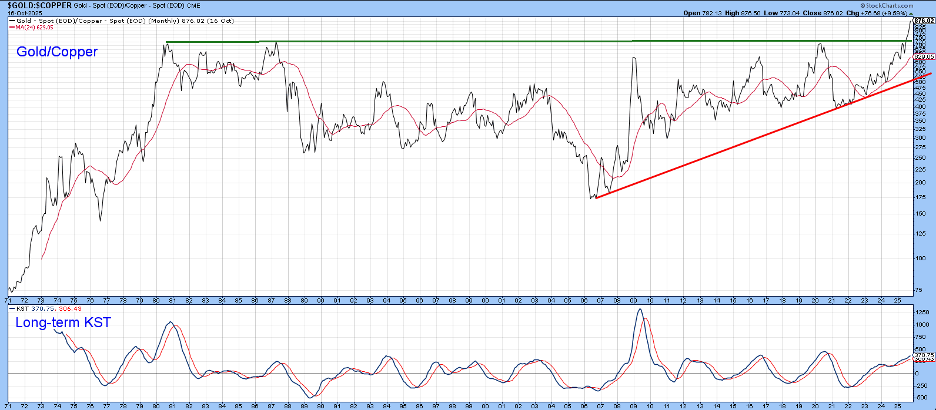
It also sets the scene for our final chart featuring the gold/copper ratio. This is another relationship that has just emerged from a multi-decade consolidation. It originally moved above the green resistance trendline in the late summer and has been building on that strength ever since. Remember, this breakout does not tell us that gold is going up and copper down, merely that over the very long-term, gold will outperform copper as it has since the turn of the century.
Good luck and good charting,
Martin J. Pring
The views expressed in this article are those of the author and do not necessarily reflect the position or opinion of Pring Turner Capital Group of Walnut Creek or its affiliates.


