Head and Shoulders Tops: Classic Signals, Key Phases, and a Surprise Reversal

Out of the library of price patterns, none has achieved the broad popularity of the head-and-shoulders top. This classic reversal pattern can help investors to acknowledge a change in trend, as the simple existence of the pattern serves to confirm an end to the previous uptrend phase.
Let’s review a couple of ideal examples of the head-and-shoulders topping pattern, with a focus on the three phases that are essential for validating the signals. Then we’ll finish with a recently failed pattern that shows a resurgence in the uptrend phase for a widely-followed steel company.
The Classic Head and Shoulders Top — JNJ
Back in 2024, after rallying off a spring low around $138, shares of Johnson & Johnson (JNJ) pounded out a pattern of higher highs and higher lows en route to a major top around $163. Then, in October, instead of making yet another new high, JNJ established a lower price high. This represents the “Setup” phase, where we can visually detect an emerging price pattern on the chart.
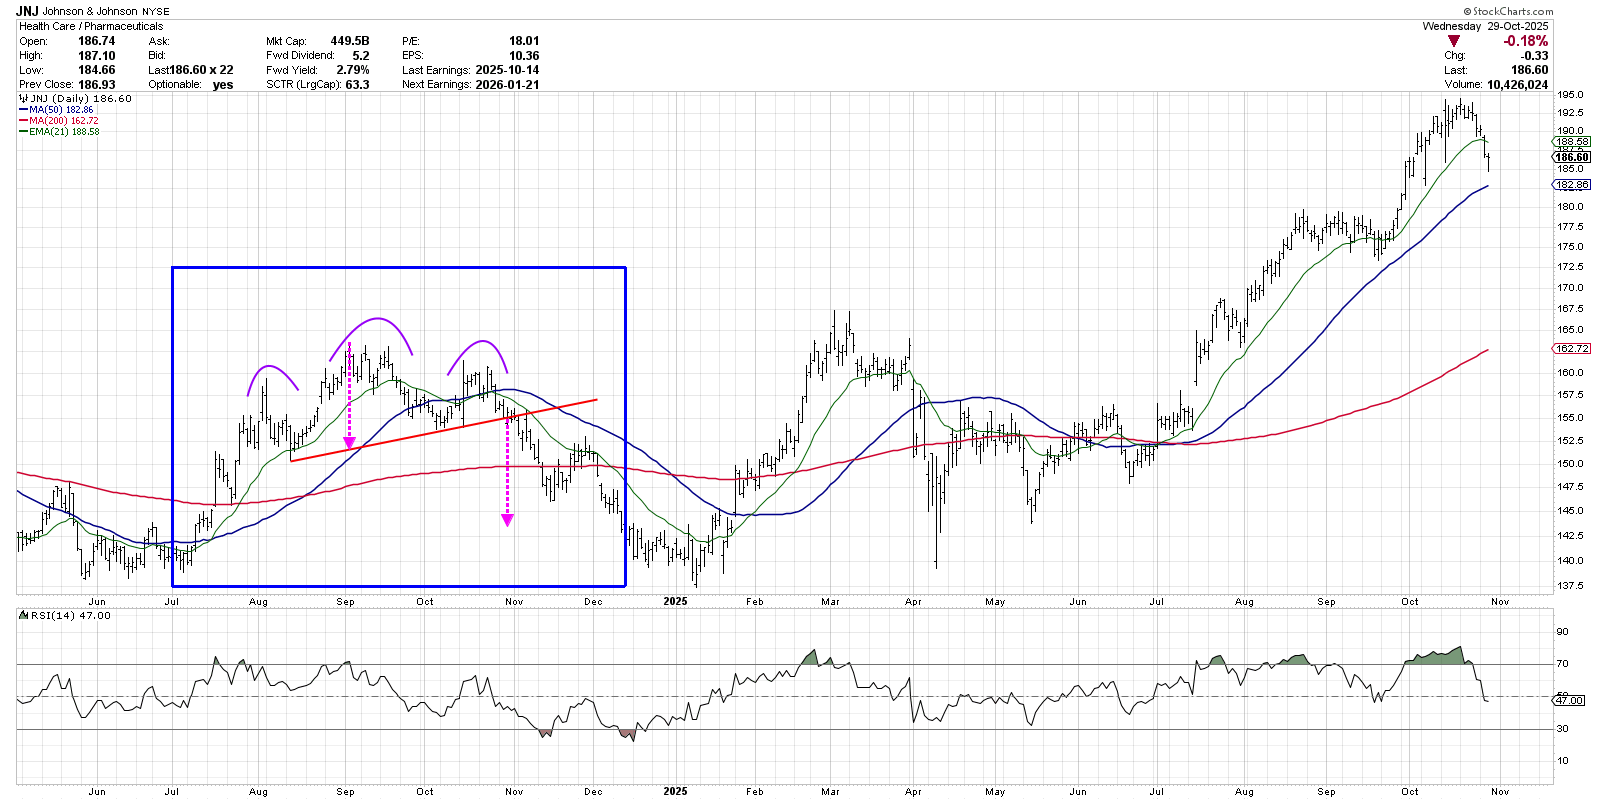
An ideal head-and-shoulders top should have a natural symmetry, where the left and right halves of the pattern are fairly similar in terms of price and duration. The most important level in the pattern is the “neckline”, which is a trendline formed by connecting the swing lows between the head and the two shoulders. JNJ broke down through its neckline in early November 2024, completing the second phase, which I call the “trigger.”
Feeling a need to brush up on your price patterns? Our Market Misbehavior premium members have access to a training course “Three Steps to Every Signal” where we break down these three phases in greater detail. As a premium member, you’ll also have access to our Weekly Flight Plan report as well as our member community, where you can ask questions and learn from others! Check out the premium membership and don’t forget to use code STOCKCHARTS at checkout for 30% off your first 12 months on any plan.
Once the neckline has been broken, I look for one further move in the direction of the breakout. This “confirmation” phase serves to validate the pattern by demonstrating that the initial breakdown was followed by further selling pressure. This last phase helps to avoid whipsaws, where a break of the neckline is followed by immediate buying and an upside reversal.
Head and Shoulders With RSI Divergence — D
The chart of utility stock Dominion Energy (D) featured a head-and-shoulders top around the same time as JNJ. In the fall of 2024, D established a price peak around $59, with lower peaks forming the shoulders on each side. A clear-cut neckline was violated in December 2024, with additional follow-through validating the breakdown.
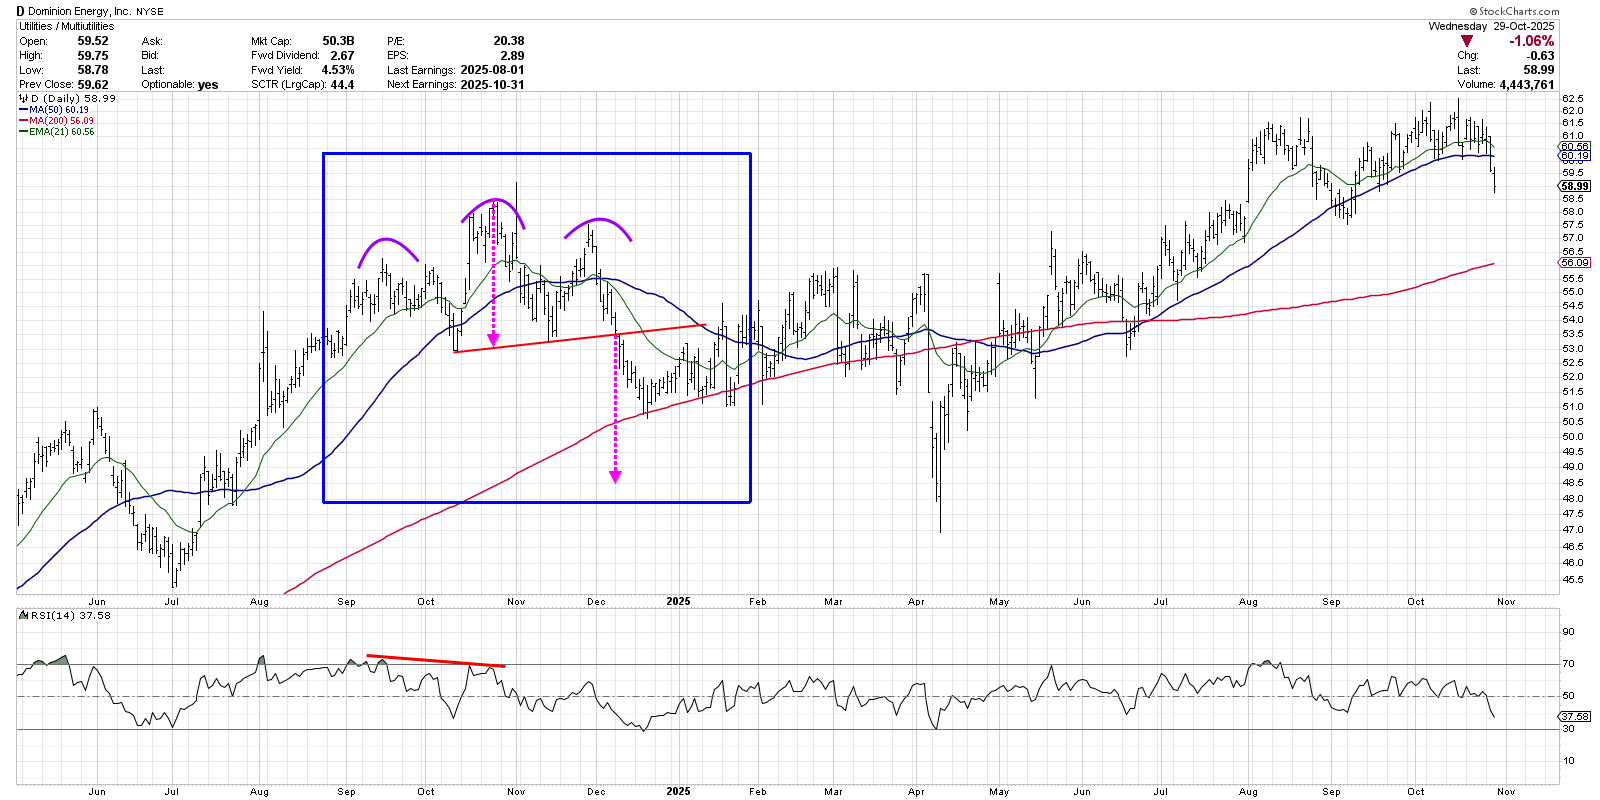
Technical analysts often use the height of the head and shoulders pattern to identify a minimum downside objective. In the case of Dominion, that would yield an initial downside target around $48–49. Before D reached this downside objective, the 200-day moving average served as a key support level. Dominion bounced off the 200-day well into early 2025, before finally breaking down and reaching the downside price target in April 2025.
Between the left shoulder and the head, we can observe a bearish momentum divergence formed by higher prices and lower RSI readings. This is actually a common feature of the head-and-shoulders top, because the weaker momentum into the head of the pattern indicates waning upside momentum and presages the decline into the right shoulder.
The Failed Head and Shoulders — NUE
Do head-and-shoulders topping patterns always work out? Of course not. In fact, I was taught that one of the most bullish signals in technical analysis is a failed head -and-shoulders pattern. In the case of Nucor Corp. (NUE), the downward-sloping neckline was never broken. So with only the Setup phase successfully completed, the table was set for an upside breakout.
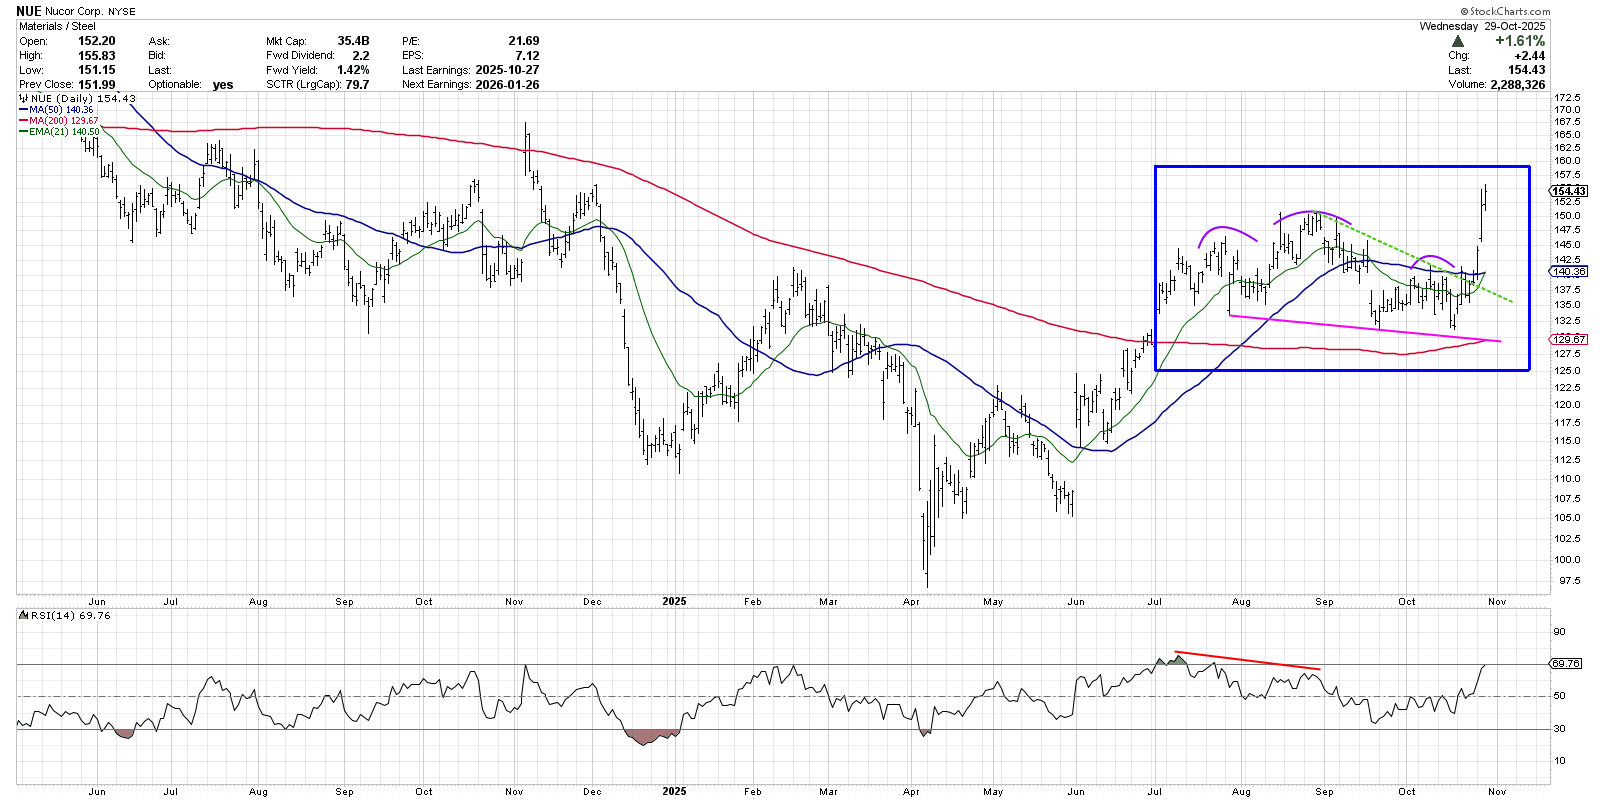
Similar to the two previous charts, we can see a clear left shoulder and head, as well as a bearish momentum divergence going into the top in late August 2025. But in contrast to the other two examples, NUE featured a downward-sloping neckline formed by the swing lows in July and September. Going into October, the neckline lined up fairly well with the 200-day moving average.
Instead of completing the Trigger phase with a break below neckline support, NUE popped higher over the last week. This latest upswing took the steel company above a trendline formed by the head and right shoulder, eventually breaking above the right shoulder and now the head. Instead of a new pattern of lower highs and lower lows as we noted for JNJ and D, Nucor has now resumed the previous bullish phase by establishing a new swing high.
Chart patterns can provide a clear framework to help us put recent price swings into proper context. By following the three phases of the price pattern — the Setup, Trigger, and Confirmation — investors can increase their success rate and identify clear signals of changes in trend!
RR#6,
Dave
P.S. Ready to upgrade your investment process? Check out my free behavioral investing course!
David Keller, CMT
President and Chief Strategist
Sierra Alpha Research
marketmisbehavior.com
Disclaimer: This blog is for educational purposes only and should not be construed as financial advice. The ideas and strategies should never be used without first assessing your own personal and financial situation, or without consulting a financial professional.
The author does not have a position in mentioned securities at the time of publication. Any opinions expressed herein are solely those of the author and do not in any way represent the views or opinions of any other person or entity.


