How Government Policy Is Driving the Stock Market in 2026

In 2026, government policy has become a primary market driver, as leadership areas are being influenced by spending, subsidies, regulation, and trade policy. In essence, decisions in Washington are moving entire industries as the government focuses on strategic goals related to energy security, housing affordability, and manufacturing.
For instance, among the top-performing areas last week were energy and shipping stocks.
Last weekend, the U.S. took control of Venezuela’s oil sales following the capture of President Nicolás Maduro — a highly unusual geopolitical move. U.S. policy now signals indefinite control and marketing of Venezuelan oil, including structured sales of barrels previously blockaded, impacting global supply expectations and oil prices.
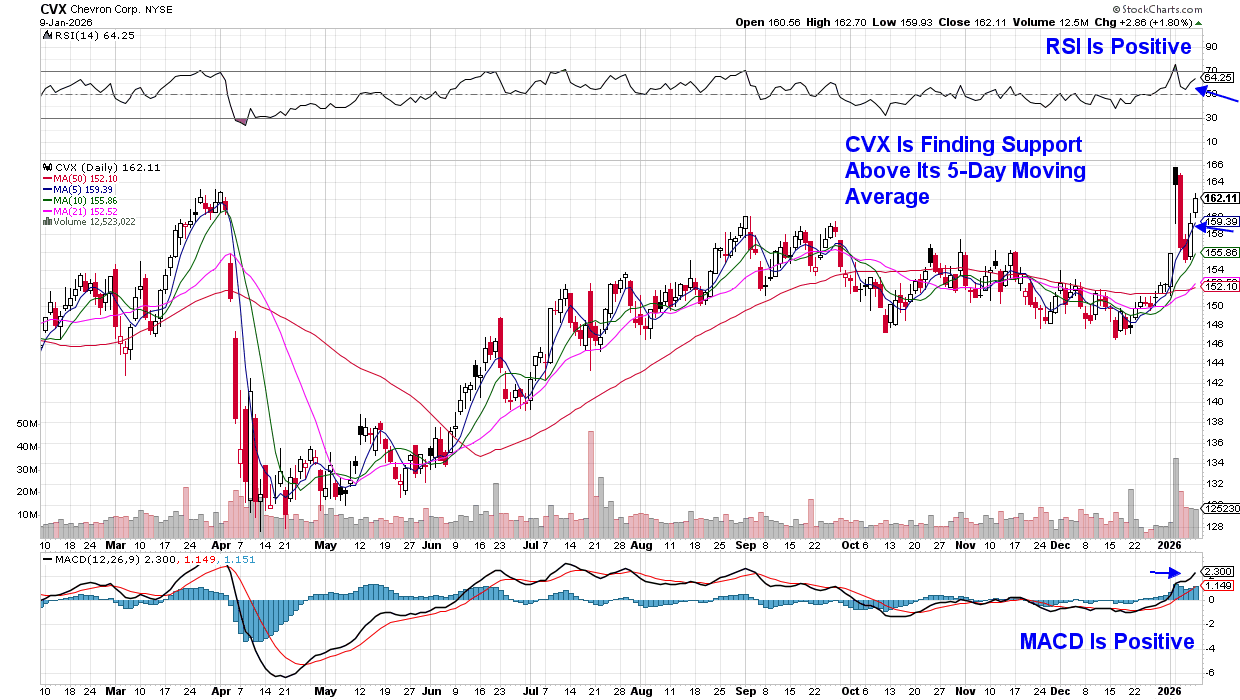
President Trump publicly urged U.S. oil majors such as Chevron (CVX), ExxonMobil (XOM), and ConocoPhillips (COP) to invest up to $100 billion of their own capital to revive Venezuela’s oil infrastructure, emphasizing safety guarantees from the U.S. government.
Chevron is the only major U.S. oil company with existing operations, infrastructure, and licenses in Venezuela, positioning it as the primary beneficiary of any U.S.-backed lifting of sanctions or regime change. The stock had a volatile week but closed above its upward-trending 5-day moving average with a positive RSI and MACD.
Housing Policy and Homebuilders
The U.S. government’s announcement to buy $200 billion of mortgage-backed securities is another example of fiscal policy directly influencing markets. In this case, it’s housing-related stocks. The action is intended to drive mortgage rates lower by increasing demand for these securities, which raises prices and lowers yields. This translates into cheaper borrowing for homebuyers.
The announcement triggered a surge in real estate and mortgage-finance stocks as investors bet on a potential rebound in housing demand. Companies such as homebuilders, mortgage lenders, and mortgage servicers saw notable gains as markets priced in improved financing conditions.
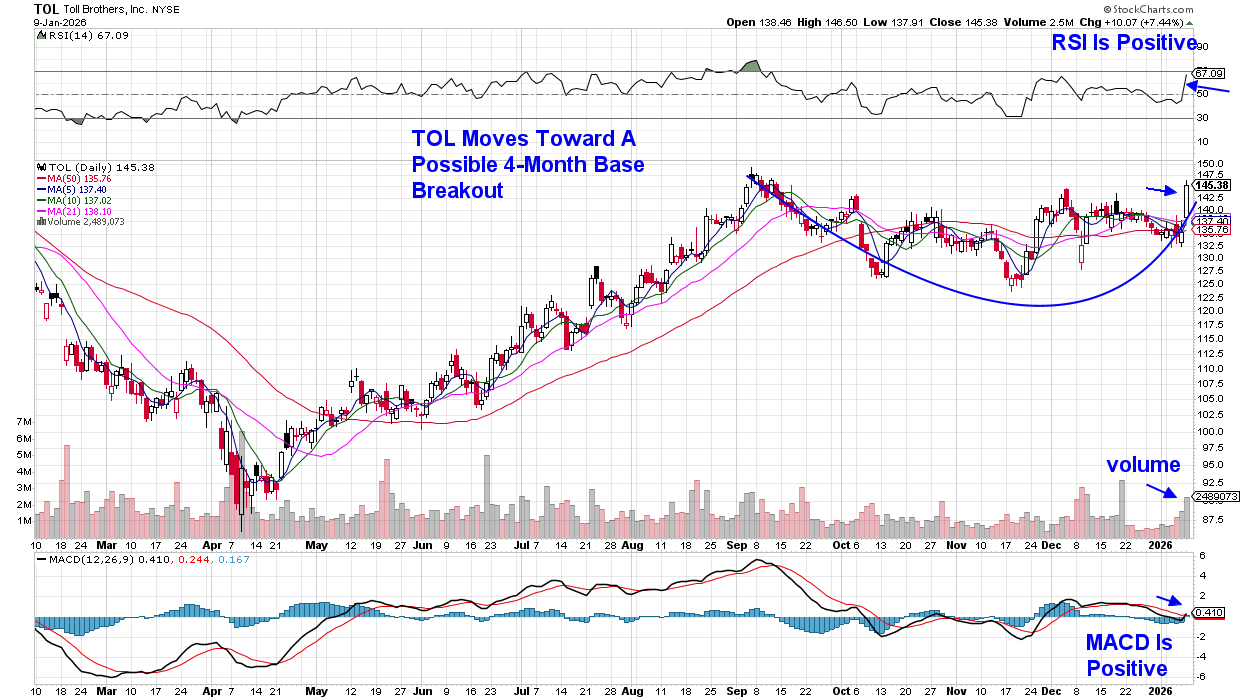
Below is the daily chart of Toll Brothers (TOL), which has fared better than its peers, driven by its resilient luxury housing model. While the stock is in a bullish position, economists caution that lowering rates alone doesn’t fix underlying issues such as housing supply shortages, which are key drivers of long-term affordability.
Industrial Policy and Semiconductors
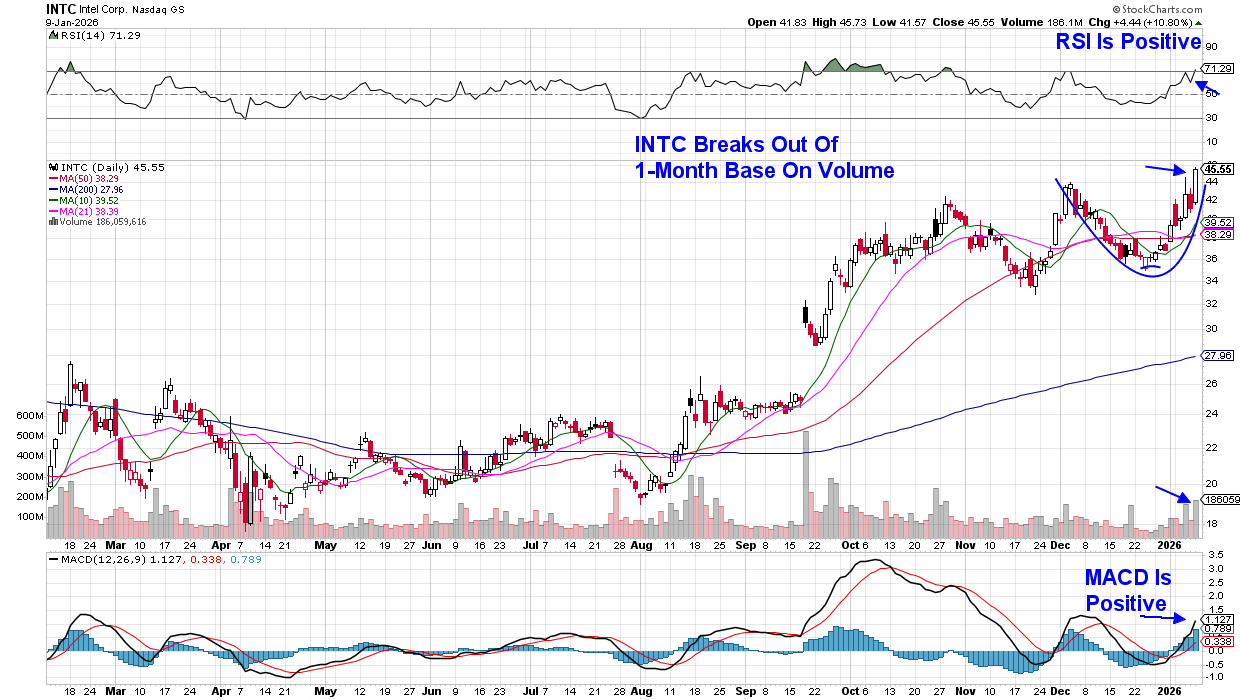
In a striking example of government influence in corporate America, the U.S. government now holds a significant equity position in Intel (INTC). Friday’s meeting between President Trump and Intel’s CEO, Lip-Bu Tan, pushed the stock up 10% following reports that the meeting “went well.”
The federal government is actively supporting domestic chip production as well, which has benefitted the outlook for other companies. The gain shows how policy signals alone can move stock prices, even ahead of operational improvement.
A Market Increasingly Driven by Policy, Not Just Profits
Government policy is no longer just influencing interest rates. It is reshaping demand, supply chains, capital allocation, and competitive dynamics across major sectors of the market. Stocks are increasingly sensitive to Washington’s decisions, not just corporate fundamentals.
For investors in 2026, understanding policy direction and political incentives is becoming as important as tracking earnings growth. If you’d like to be kept up to date on policy shifts and the stocks poised to directly benefit, use this link here for a 2-week, no-cost trial of my twice-weekly MEM Edge Report.
Warmly,
Mary Ellen McGonagle
MEM Investment Research


