How to Use New Highs to Spot Market Strength
The two-week ceasefire may have been just the news the stock market was waiting for.
Even though the S&P 500 ($SPX) and Dow Jones Industrials ($INDU) closed lower on Friday, both indexes still finished the week on a strong footing. The Nasdaq Composite ($COMPQ), meanwhile, closed higher for an eighth straight session, and its recent strength performance deserves a closer look.
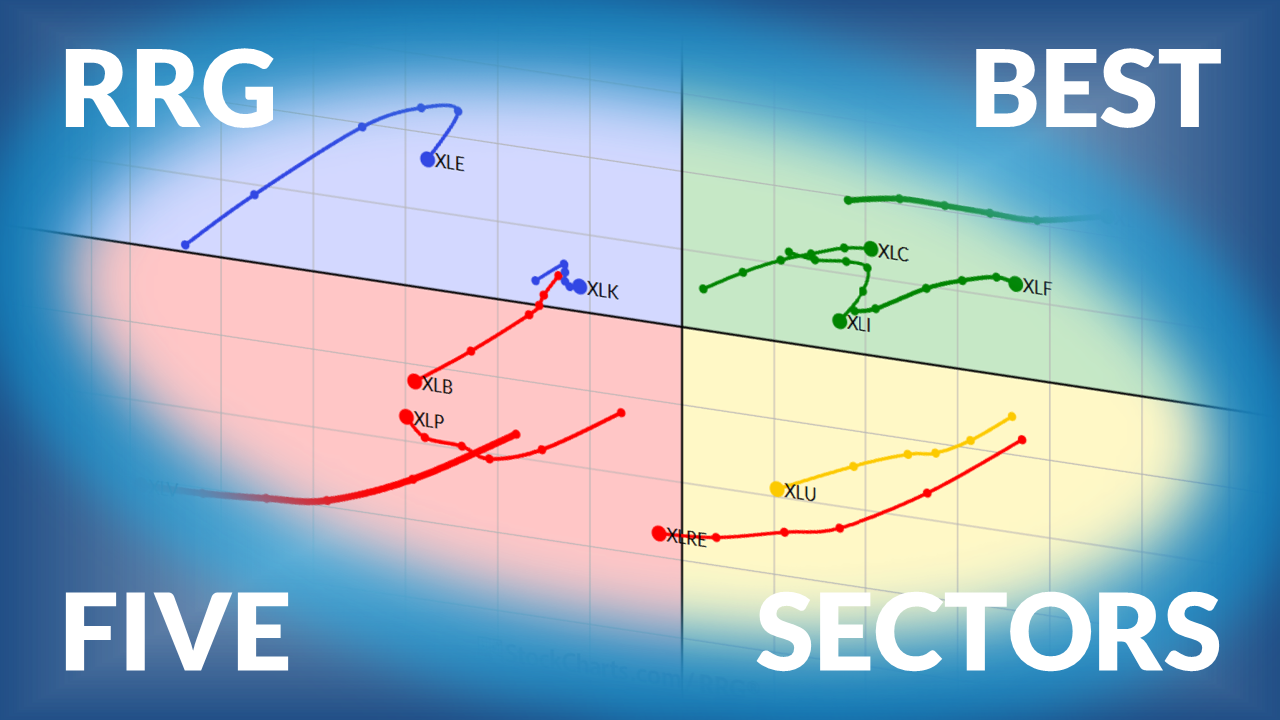
Examining sector performance helps shed some light. Technology led the S&P 500 sectors this week, while Energy landed at the bottom. This is a notable reversal from the leadership we’ve seen in the past few weeks.
Here’s what’s interesting: not all tech stocks participated in the move higher. Semiconductors helped drive the Nasdaq higher, while software stocks continued to struggle. To see for yourself, you can bring up a chart of the iShares Expanded Tech-Software Sector ETF (IGV) and compare it to the VanEck Semiconductor ETF (SMH).
👉 Here’s a link to the chart.
This could be a sign that the AI trade is starting to heat up again. But how can you find out which stocks are doing the heavy lifting?
One way is to use the New Highs panel on the Market Summary page. Click the Weekly Highs tab, and you’ll quickly see where the leadership is. In the image below, 8% of Nasdaq 100 stocks reached an all-time high this week, while 39% hit a one-month high.
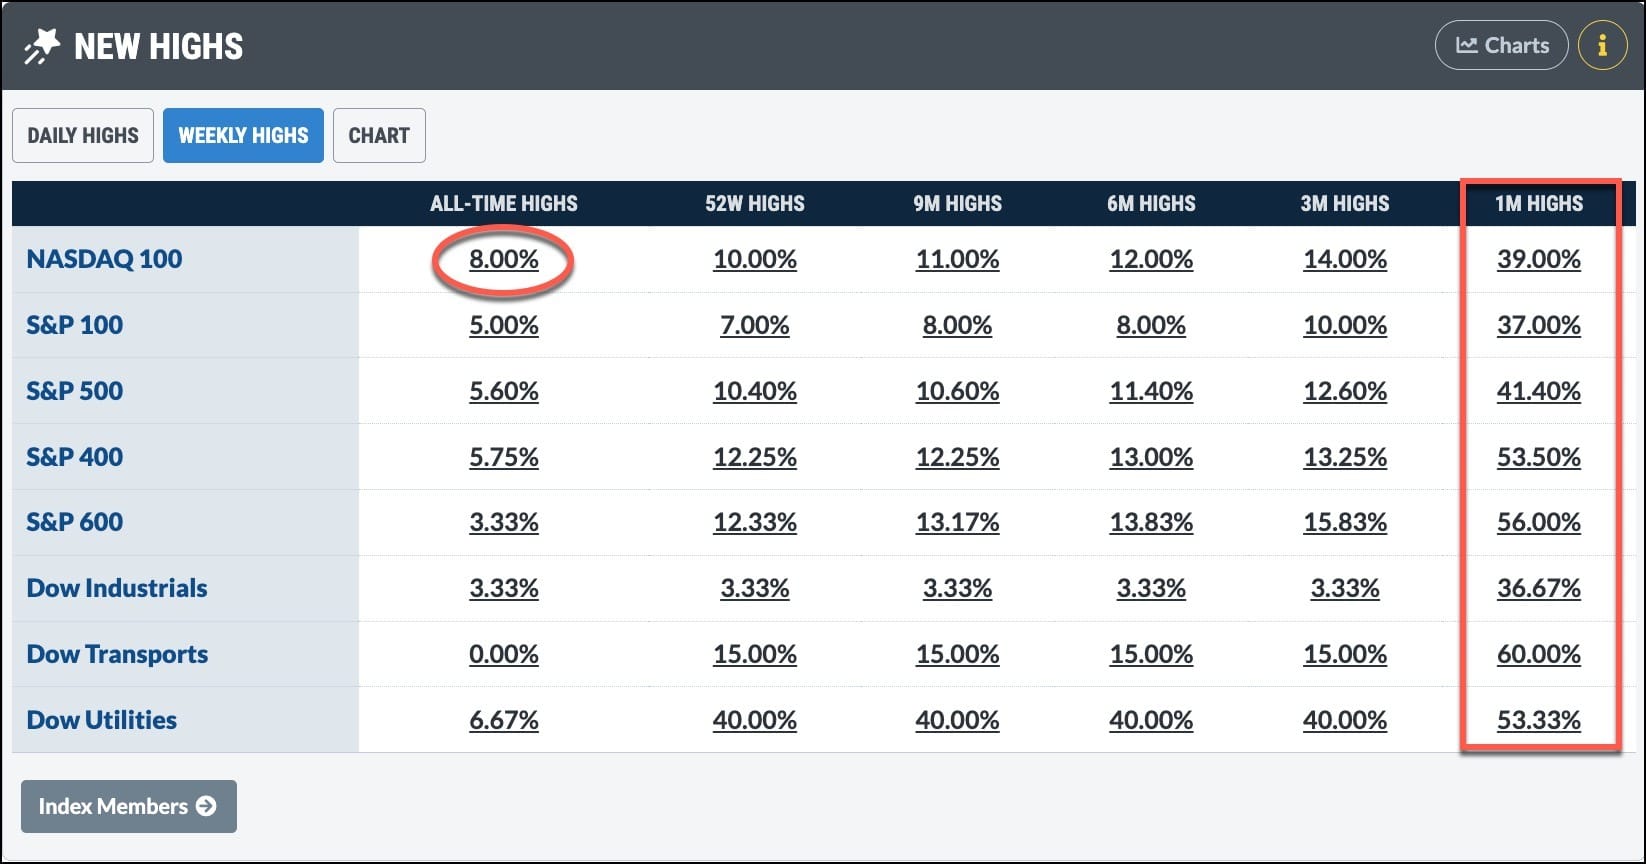
Want to know which stocks are behind these numbers? Click the percentage, and you’ll see that for the Nasdaq 100, the 8% reveals eight stocks, six of which were semiconductor stocks. The other two were hardware stocks.
The New Highs panel doesn’t just tell you that an index is strong. It helps you see which groups are leading the move higher.
You can see it in other indexes besides the Nasdaq 100. In the Dow Transports, no stocks hit all-time highs, but 60% reached new one-month highs. Even more interesting is that trucking and airline stocks showed up on that list. In an environment of rising oil prices, this info will make you stop and think a little harder.
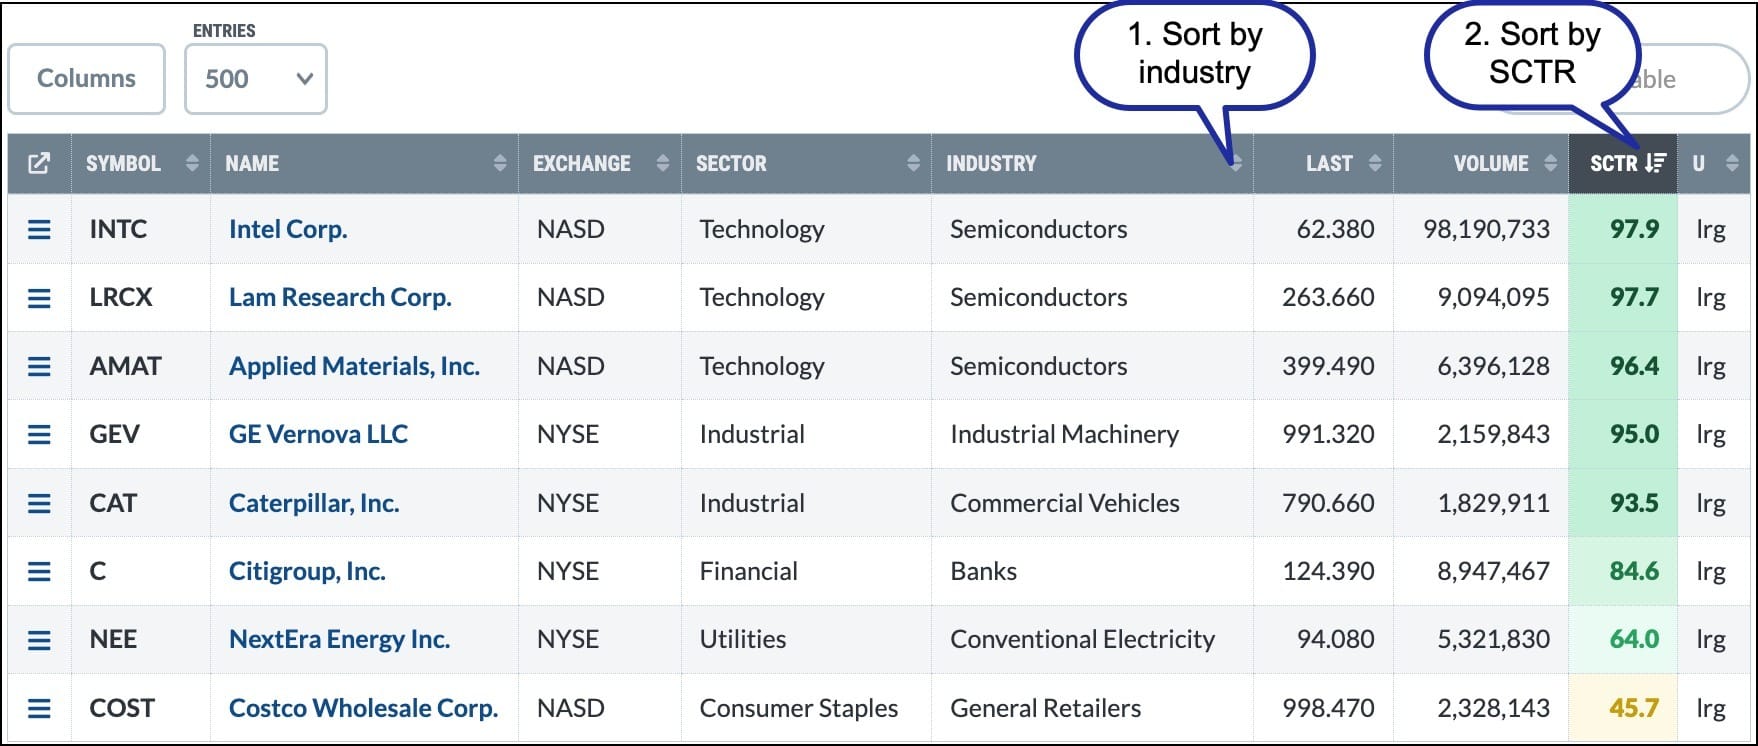
When you click on the percentage, you’ll see the scan results of the specific criteria. A helpful feature of the results is that you can sort them by each column. I prefer to sort by Industry and then by SCTR (StockCharts Technical Rank) to see which stocks are emerging as leaders within an industry group.
For more insight, compare the New Highs panel to the New Lows panel. Are more stocks making new highs or new lows? Which industry groups are starting to strengthen? Which stocks are separating from the pack?
Retail investors may not have access to the same information that institutions use, but features like the New Highs and New Lows panels can offer valuable clues about where money is flowing and which areas of the market deserve attention.
All StockCharts members have access to the data and charts in the Market Summary page. Make it a part of your market analysis routine and, over time, you may start to see patterns that can help you make unemotional investing decisions.
Lately, the market has been challenging, which is why traders need to come up with new ways to adapt. If you trade options, or are thinking about getting started, OptionsPlay is hosting a free webinar on Tuesday at noon ET:
What: The Stagflation Guide: Strategies for a War-Torn Market
When: April 14, 12:00 PM ET
👉 Register now.
Have a great weekend!