If Value Is Really Back, These Two Stocks Will Tell Us First
Key Takeaways
- Value leadership may hinge on breakouts in Exxon Mobil and Bank of America
- The “broadening out” trade requires strength from several sectors, namely Energy and Financials
- With key economic data on tap this week, value stocks’ show-me moment is upon us
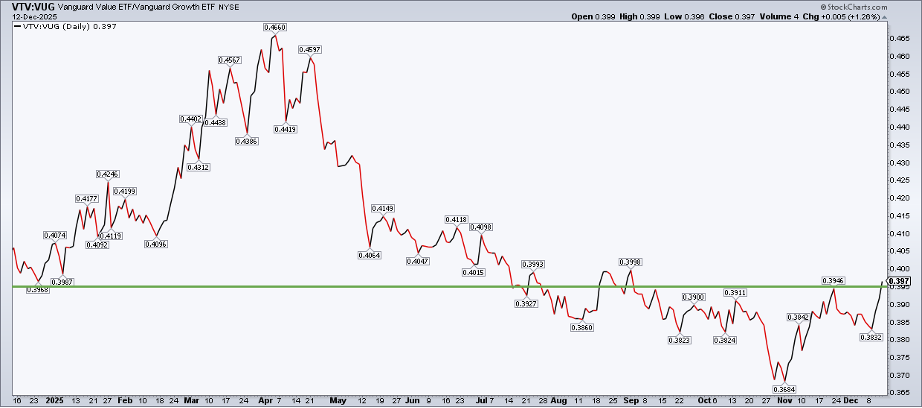
Value investors had reason to cheer last week. The style led the market’s gains following the Fed meeting, and the Vanguard Value ETF (VTV) is now at its best level relative to the Vanguard Growth ETF (VUG) in more than three months. Is that a sign of more cyclical strength to come in 2026? It seems more than a few Wall Street forecasters are making that assertion.
I think it’s certainly possible, too, but it will require leadership from two bellwether, economically sensitive names: Exxon Mobil (XOM) and Bank of America (BAC). Does that pair raise your eyebrows? Perhaps, considering that oil price action has been dreadful for the better part of the last three and a half years, while BAC has been a long-time laggard among the Big Four U.S. banks.
In my view, if these two blue chips step up, the value-versus-growth rally can really gain steam next year. If they stumble, the year-end value renaissance will be just another flash in the pan. Let’s inspect both charts through a technical lens to glean broader macro insights as we position for 2026.
XOM: Coiled Beneath the Highs, Bulls Hope for Good Year-End Tidings
Beginning with XOM, shares of the $501 billion market-cap integrated oil and gas company within the Energy sector remain below their October 2024 all-time high of $126. The stock fell to a post–Liberation Day low of $98 in April and has since stair-stepped higher to within earshot of that record peak.
Notice in the chart below that a golden cross pattern occurred in late August, helping to confirm that the bulls were grabbing control of the primary trend. Just a few weeks later, the long-term 200-day moving average inflected higher, another favorable long-term signal. The RSI momentum oscillator up top is “good, not great,” in my estimation, as it generally ranges between 40 and 70, with slightly lower highs recently as price has ascended.
But look at the volume-by-price profile on the left side of the chart. There remains a significant amount of shares traded up to about $124, which puts the onus on the bulls to lift XOM through material overhead supply. If we do see a breakout, though, a measured-move price objective of roughly $155 would be in play, based on the height of the trading range that’s been ongoing for nearly three years.
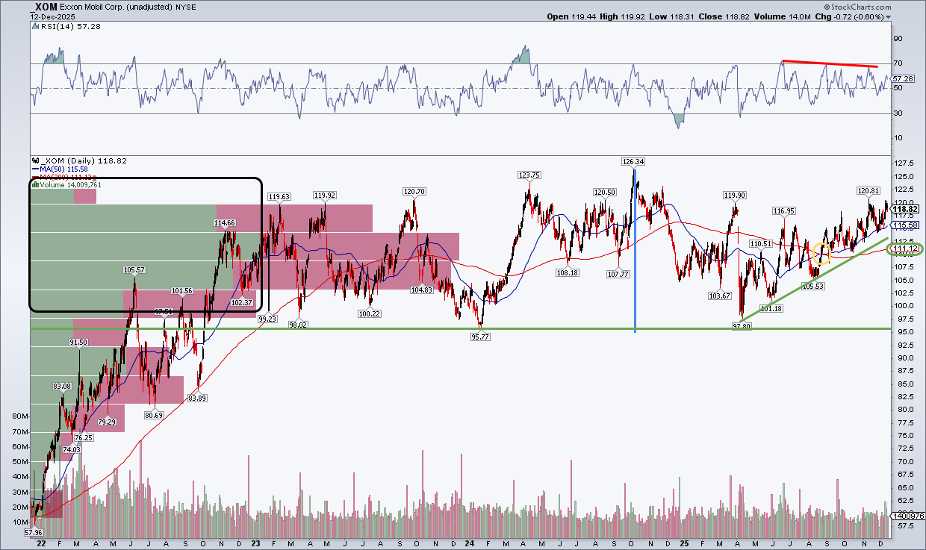
The XOM Upshot
A breakout, particularly on a weekly closing basis, above $126.34 may result in 20% upside in short order. Value investors should eye it closely, while active asset allocators may want to shift away from the Mag 7 and growth names if that breakout occurs.
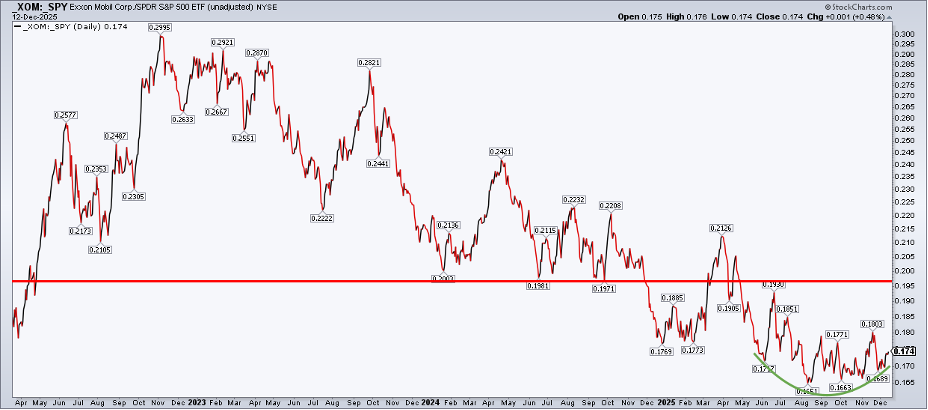
Relative strength analysis augments the assessment. XOM compared to the SPDR S&P 500 ETF (SPY) reveals a years-long downtrend. Maybe a basing pattern has developed over the past handful of months, but this remains a “guilty until proven innocent” view. XOM:SPY must break through the June high to confirm a relative turn.
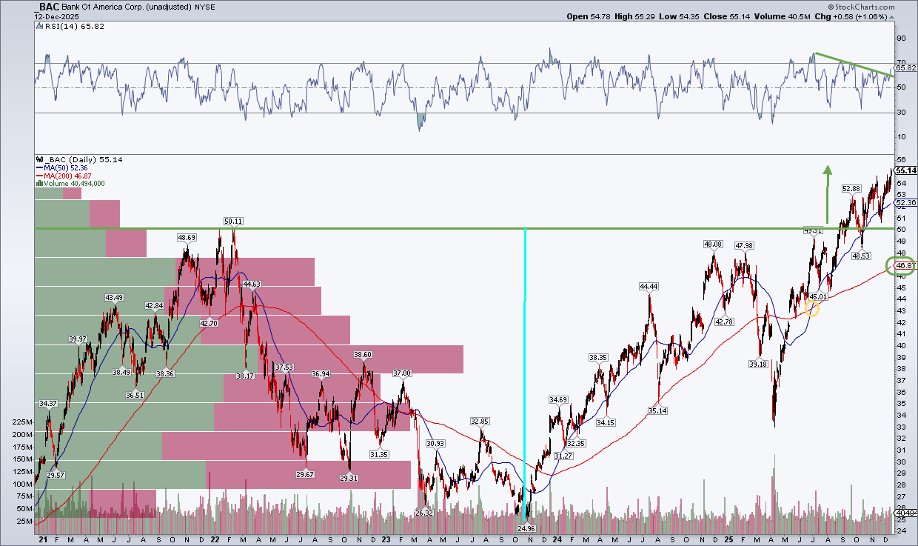
BAC’s Chart: Nice, Not Naughty
BAC, on the other hand, has been doing the right things throughout the bull market. Shares bottomed under $25 in October 2022, and while they plunged by almost a third from November 2024 to this past April, those losses — and then some — have been recovered. Today, the 200-day moving average is rising, the 50-day moving average is above it, and price is higher than both trend-indicator lines.
The RSI looks somewhat concerning, but price appears to be resolving higher, alongside a breakout in the oscillator. Traders like to see that kind of momentum and price confirmation. Concerns regarding resistance in the $48 to $50 zone have been relieved, with BAC printing an all-time high settle last Friday.
It’s now clear skies ahead — there’s no meaningful volume or congestion above the current price. What’s more, a bullish measured-move price target of roughly $75 is in play, based on the $50-to-$25 crash and subsequent breakout.
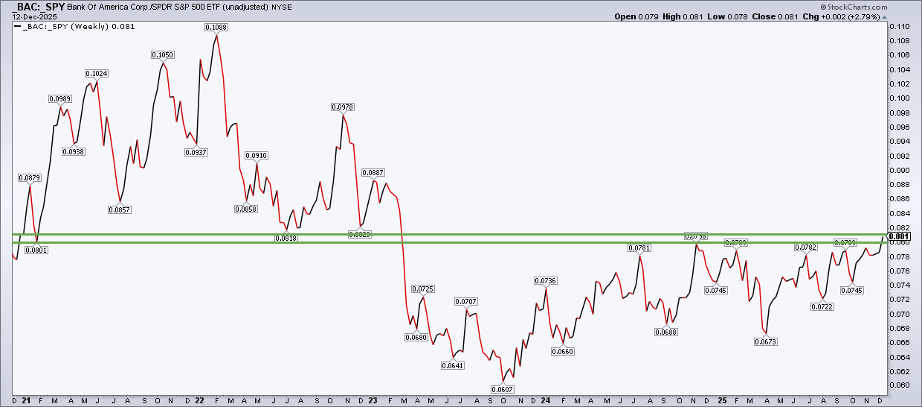
BAC compared to SPY is still somewhat of a show-me story. Yes, it closed at a multi-year high last week — no doubt bullish. But I’m not yet convinced that the current level won’t give value investors fits. A few more weeks of strength would not only support a longer-term case for value over growth, but also help cement a new, sustainable leg higher in BAC’s relative performance versus the U.S. large-cap index.
Why BAC Matters More Than Its Peers
Stepping back, it makes sense why XOM is so critical to the style-shift narrative. But why is BAC so crucial? Why not JPMorgan (JPM), Citigroup (C), or even Goldman Sachs (GS)? It has to do with Bank of America’s more retail-oriented customer base. It’s simply more tied to Main Street—and even lower-end consumers.
Lagging JPM by seven percentage points year to date and down more than 30 percentage points to C and GS on the year, if CEO Brian Moynihan’s company demonstrates leadership, that would bode very well for the value style.
The Bottom Line
I’m watching XOM and BAC for clues on the key value-versus-growth trade as the calendar flips to 2026. Macro factors will be key, such as a rebound in oil prices and improving conditions for low- and middle-income households, as well as domestic small businesses. The charts will probably be the first tell, so keep the ones I’ve shared today close by. A December to remember between the two blue-chips could even send the Dow through 50,000.
Disclaimer: This blog is for educational purposes only and should not be construed as financial advice. The ideas and strategies should never be used without first assessing your own personal and financial situation, or without consulting a financial professional.


