Ignore the Headlines. Let the Charts Do the Talking.
This week’s market action is a reminder of why it’s important to tune out the noise and tune into the charts.
Three straight down days are enough to make any investor a little uneasy. Headlines clog up your inbox, opinions pile up, and it feels like something terrible must be happening.
Instead of reacting to the sound bites, though, it helps to step back and look at what the charts are telling us. Because when you look at the broader price action over the past year, the pullback may not look as bad as it felt.
A Closer Look at the Indexes
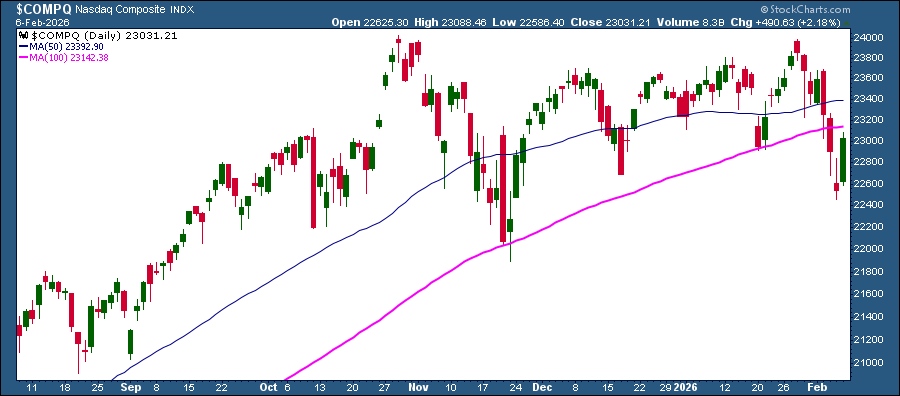
Of the three major indexes, the Nasdaq Composite ($COMPQ) took the biggest hit. No surprise there; software stocks have been under a lot of pressure, and Thursday’s close didn’t inspire much confidence. Add in Amazon’s slide after the close, and it felt like the week could end ugly.
However, the market recovered on Friday, as did the Nasdaq. The index is now close to its 100-day Simple Moving Average (SMA). A break above it with a follow-through would be an encouraging signal for tech stocks.
Outside of Tech
While tech was wobbling, other areas of the market were looking much better.
- The Dow Jones Industrial Average ($INDU) keeps grinding higher, having closed above 50,000 and notching a new closing high.
- The Dow Jones Transportation Average ($TRAN) is also rallying, a sign that the economy is still strong.
- The S&P 600 Small Cap Index ($SML) continues to rally higher, marking a new record close.
According to classic Dow Theory, when Transports and Industrials advance together, it’s an indication that the bull market is still alive. The strength from small caps also supports the upside rally.
So, What’s Next?
Friday’s strong rebound is another reminder that the bull market still has legs. This could be an opportune time to add long positions to your portfolio. But how do you decide which stocks to add? That’s where the right tools make the difference.
We’ve recently rolled out updates to the StockCharts Scan Workbench, making it easier to find stocks that match your criteria without writing code. Inside the Advanced Scan Workbench, you’ll see simple dropdown menus and clickable scan components. Choose the ones you want, click the plus sign (+), and build your scan. It’s simple, powerful, and intuitive.
In the video below, our Chief Strategist, Grayson Roze, walks you through how it works and shows how you can go from idea to actionable list relatively quickly.
One of the biggest challenges of investing is deciding what to buy. These scan engine enhancements are designed to make that decision clearer and faster. This weekend would be a great time to explore this tool.
Strong Trends, Strong Stocks
With stocks back in “trend mode,” you may want to join our upcoming OptionsPlay webinar, “My Go-To Trend Following System.”
In this session, you’ll learn how to spot trends earlier and how to apply options strategies that align with those moves
🗓️ When: Tuesday, February 10, 12 PM ET
And don’t forget! The Fantasy Stock Draft II takes place this Saturday, February 7, at 10:00 AM ET.
After a week that started on edge and ended on a positive note, we can all head into the Super Bowl with a little more peace of mind. Let’s see if the game can top the market drama.
Have a great weekend!


