Intermarket Crosscurrents: What Quarter-End Trends Signal for Q4

Key Takeaways
- Stocks have been strong in September despite a litany of macro concerns
- Bonds are cooling off after rallying into the Fed meeting, stoking worries of what transpired a year ago
- Commodities’ strength centers on gold and silver, but industrial metals are perking up
Stocks approach the end of the third quarter on their front foot. The S&P 500 ($SPX) rose to close out last week and traded higher to begin Jobs Week on Wall Street. Perhaps it’s the perfect “climb the wall of worry” setup, with material government shutdown risks and bearish seasonals still in play. Consider that U.S. large caps are pacing for their best September since 2010, all while investor sentiment is still soft.
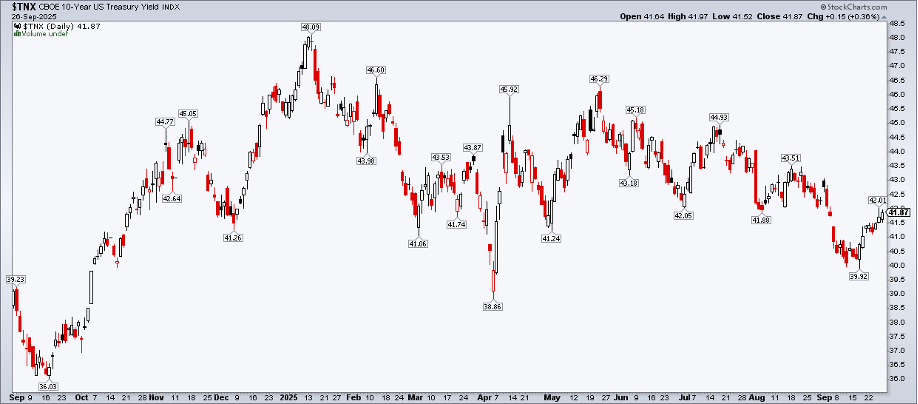
Treasury Yields Climbing Higher
There are concerns (not fears) in the Treasury market. Since the Federal Reserve cut its policy rate target by a quarter point on September 17, the yield on the benchmark 10-year note has inched up from a knee-jerk low of 3.99% to around 4.20% as the calendar gets ready to flip to October. It has the feel of what occurred 12 months ago, when the Fed “went big” with a half-point cut, only to see the 10-year yield surge from 3.6% to 4.8% over four months.
I have always found quarter-end to be an ideal time to revisit intermarket analysis, or the correlations between the four major asset classes: stocks, bonds, commodities, and currencies. Let's begin with stocks.
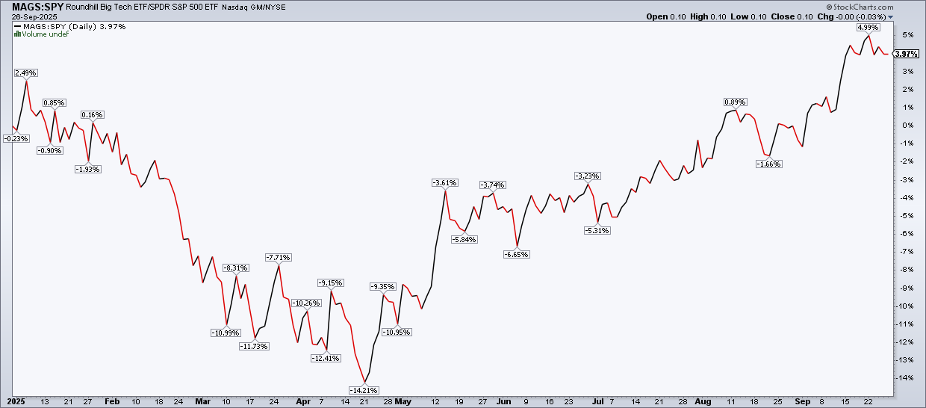
Mag 7 Stocks Continue to Dominate
The S&P 500 is poised for its fifth consecutive monthly advance. Yes, the Magnificent Seven have carried the torch since April 21. I track the performance of the Roundhill Big Tech ETF (MAGS) as a Mag 7 proxy. It boasts about 20 percentage points of alpha to the S&P 500 ETF (SPY) on a total return basis since early Q2. You might think it’s the same old story of AI and mega-cap tech eating the world, but that’s not the case.
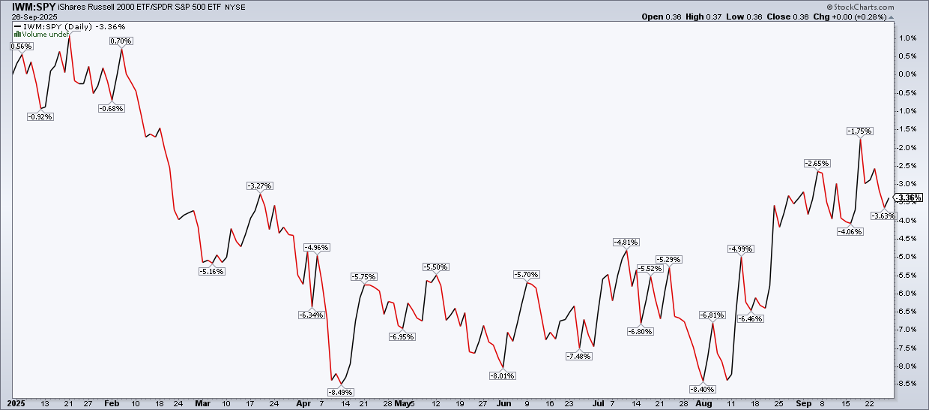
Small Caps and Market Breadth
Earlier this month, I called out big strength in small-caps. The iShares Russell 2000 ETF (IWM) logged a new all-time high (at long last), triggering a bullish breakout price target above $300. IWM’s relative strength has petered out somewhat, however.
The ratio chart of IWM to SPY is roughly unchanged from five weeks ago, but small caps have actually outperformed since mid-April. So, the “broadening trade” has merit.
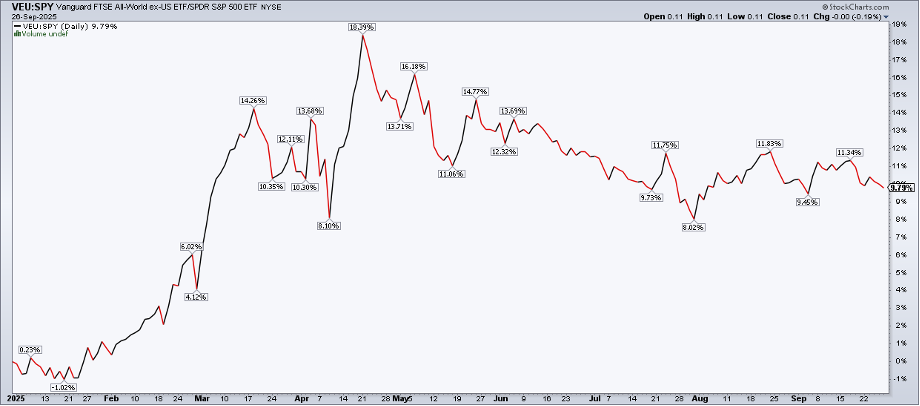
Global Equities: Cooling But Strong
To gauge breadth, we mustn’t ignore overseas happenings. The Vanguard FTSE All-World ex-US ETF (VEU) stormed out of 2025’s gate versus SPY, jumping a fast 18 percentage points on the relative performance chart. International stocks’ alpha has cooled, thanks to Q3 dollar steadiness.
In fact, VEU has given back almost eight percentage points of outperformance since mid-April. To be clear, foreign equities appear strong on an absolute basis, likely to print their best quarterly closing price on record.
Shifting gears to bonds, it’s déjà vu all over again. Interest rates snapped back after the Fed resumed its rate-cutting cycle. Like in Q3 2024, there was a significant growth scare that potentially hit a climax right before the FOMC gathered two weeks ago (with a new voting member in the room). But after a stronger-than-expected Q2 GDP revision and stabilizing jobless claims, there’s talk of the U.S. economy possibly being “early cycle.”
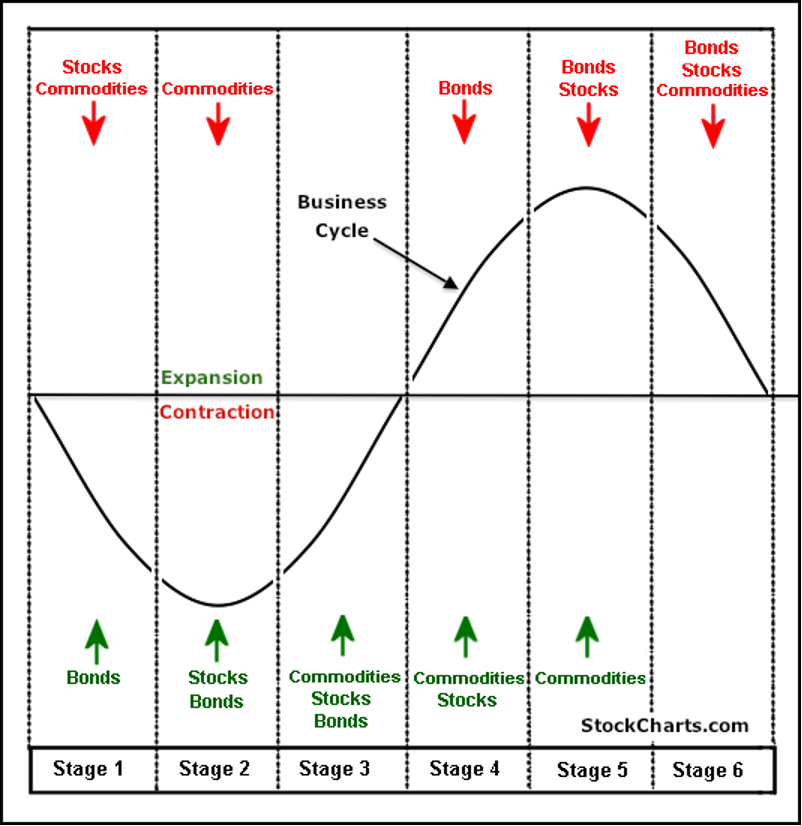
Sector Rotation Analysis (Inflationary Environment)
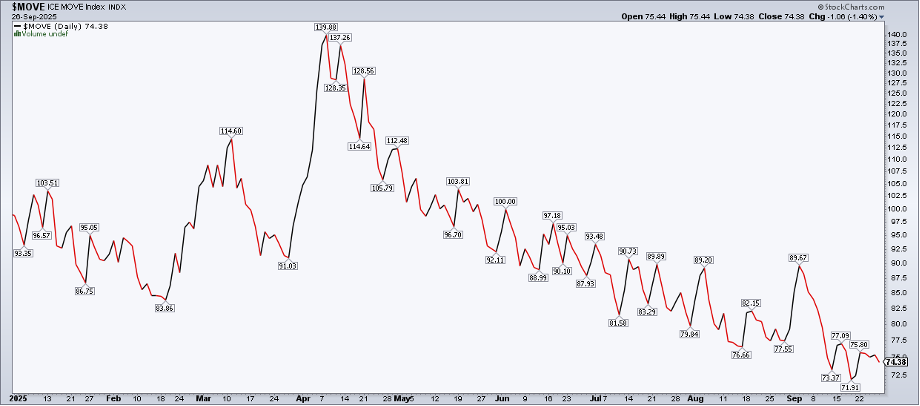
Bond Market Volatility Easing
The bond market goes beyond Treasuries, though. Corporate bond spreads are near their lowest levels going back to the 1990s as we step into the fourth quarter. Bond market volatility, meanwhile, has trended lower since April, and that’s a welcome development for would-be first-time homebuyers.
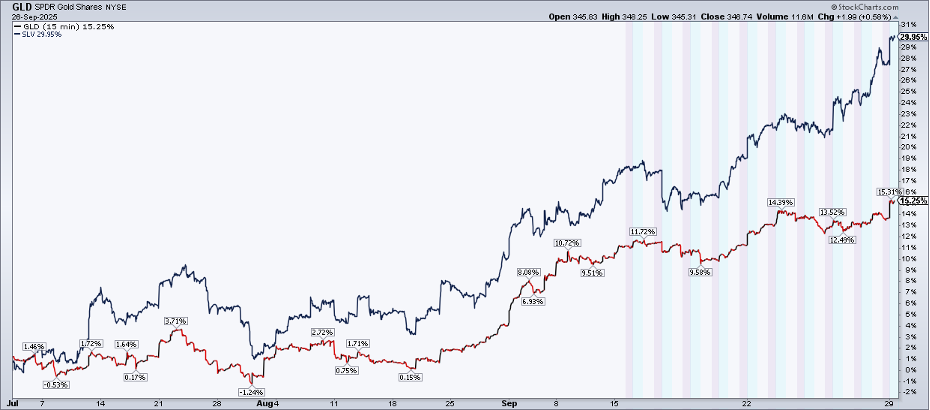
Metals Shine, Crude Lags, Dollar Holds the Line
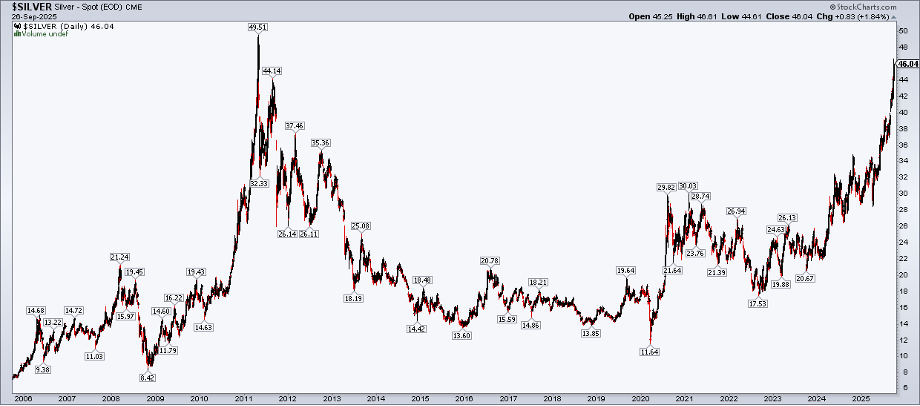
Over in commodities, gold and silver have performed brilliantly. With just a handful of trading hours left in Q3, the former is up 15% for the quarter, and the latter has soared 30%. Looking ahead, all eyes will be on the $4,000 per troy ounce mark for gold as year-end nears, while spot silver’s 2011 all-time high of $49.51 is absolutely in play.
Silver may test its 2011 all-time high in Q4.
WTI crude oil, normally the barometer of overall commodity sentiment, has been quiet just about all year (sans mid-May around the Israel-Iran conflict). Some recent strength has helped to lift the Invesco DB Commodity Index Tracking Fund (DBC) to its best level since June.
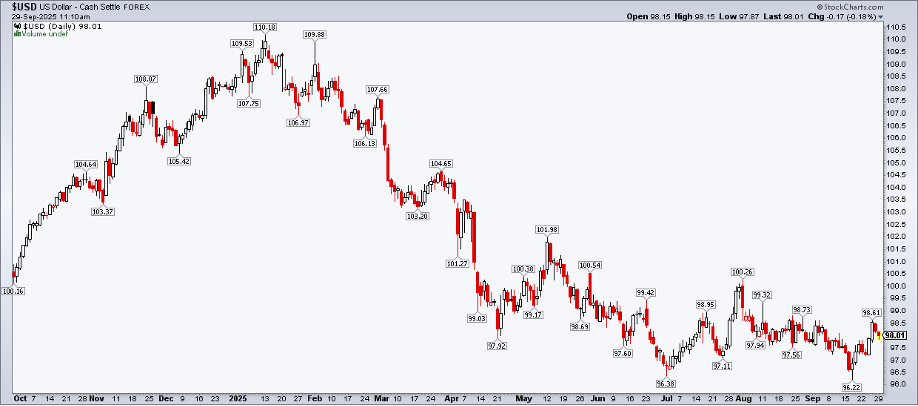
Let’s wrap up with the greenback. Despite all the handwringing, the U.S. Dollar Index ($USD) is unchanged from April 21. Dollar bulls and bears have duked it out, sparring over the ebbs and flows in U.S. jobs data, loud Fed speak, pressure applied by President Trump on the Fed, and a landmark tax bill inked on Independence Day. Tariffs appear to be having a negligible impact on major forex pairs like the EURUSD and USDJPY.
For now, I’m watching key support between 96 and 97 on the U.S. Dollar Index. If that level breaks, we may see intermarket fireworks in Q4. It might be the ultimate global indicator right now.
The Bottom Line
Quarter-end is an opportune time to level set and review where markets stand. Your first objective should be to tune out the noise. You do that by focusing on price action, not the talking heads.
Stocks big and small, domestic and foreign, keep marching higher, seemingly impervious to what interest rates are doing. Precious metals have had an enduring bid in 2025, with some recent bullish attention paid to the industrial metals arena. The dollar, meanwhile, has been crickets for the better part of five months.
Disclaimer: This blog is for educational purposes only and should not be construed as financial advice. The ideas and strategies should never be used without first assessing your own personal and financial situation, or without consulting a financial professional.


