Is It Finally Time for Small Caps to Outperform?

Many areas of the market have appreciated sharply since 2021. However, small caps, either in the form of the SPDR Portfolio S&P 600 Small Cap ETF (SPSM) or the iShares Russell 2000 ETF (IWM), have made little net upside progress during that same period.
Indeed, Chart 1 shows that the RS line for the Rydex Russell 2000 ETF (RYRHX) peaked in 2011 and 2013 and has been zig-zagging on a downward path ever since. Last summer, the long-term KST started to turn up and has been working its way higher for several months. The green arrows show that sub-zero upside momentum reversals such as this have usually been followed by a meaningful rally.
The ellipses flag the two notable failed signals. However, in those instances, the KST quickly reversed and never experienced the kind of decisive MA crossover that has recently been the case. Furthermore, the RS line has successfully regained its 12-month MA and begun to edge above its 2021–2025 down trendline. That trendline break is not yet sufficiently decisive to call a turn. Nevertheless, taking the total evidence into consideration, we are presented with the most promising setup since the downtrend began.
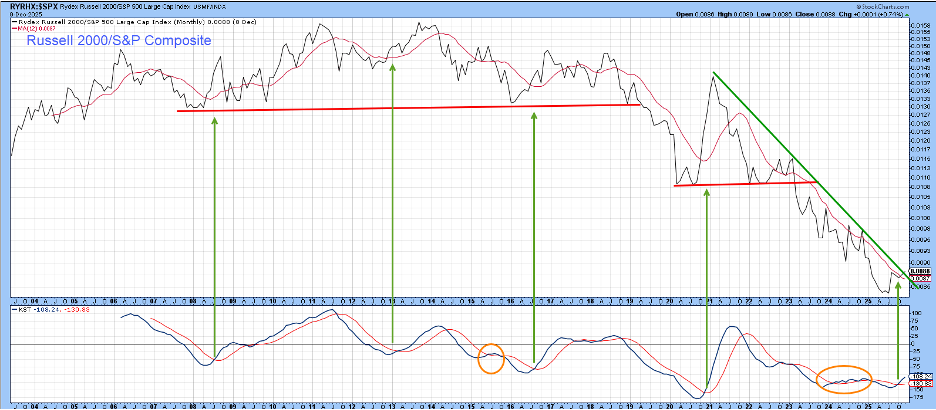
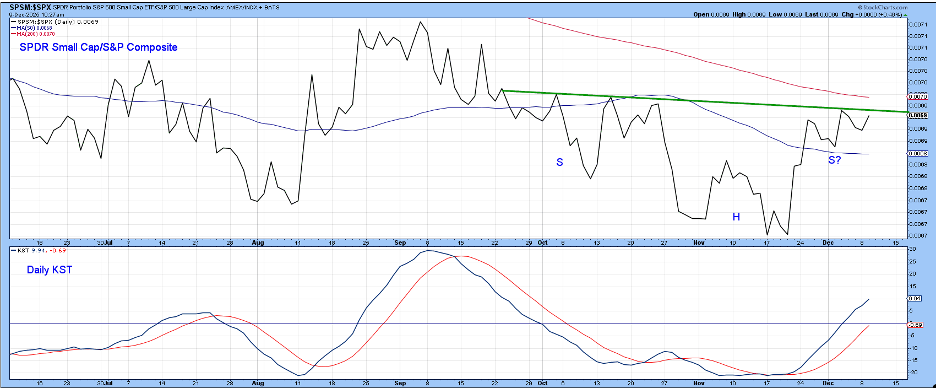
Chart 2, which focuses on the last few months of activity for the RS line for SPSM, is very close to completing a reverse head-and-shoulders pattern and regaining its 200-day MA. A positive short-term KST suggests that a breakout may well be close at hand.
Our third chart reverts to IWM and displays weekly data. The RS line and its long-term KST are featured in the lower two windows. The line itself has already crossed above its 65-week EMA and the post-2021 down trendline. The green arrows indicate that buy signals for the long-term RS KST have consistently been followed by a worthwhile rally in the price itself, which is featured in the top window. The small green arrow indicates that the KST for the absolute price has just gone bullish by crossing above its 26-week EMA.
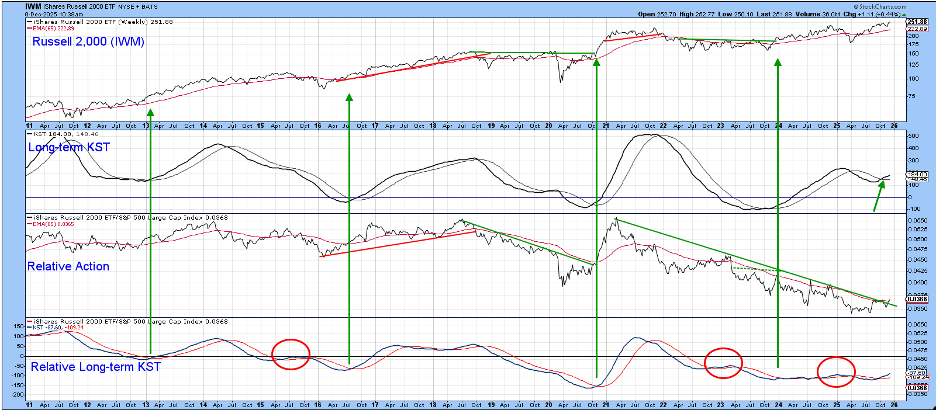
Chart 4 takes a closer look at the actual price by comparing the S&P 600 Small Cap Index ($SML) to the Special K (SPK). The green-shaded areas approximate those periods when the SPK is above its red signal line for an extended period, as is the case at present. This momentum indicator is poised to break above its post-2021 down trendline and join the price itself in a breakout above its 2024–2025 resistance line. Speaking of resistance, the dashed trendline plotted against the price has turned back numerous rallies and reactions in the last four years and is a very significant pivot point. Since the price is above this line, that’s another bullish factor.
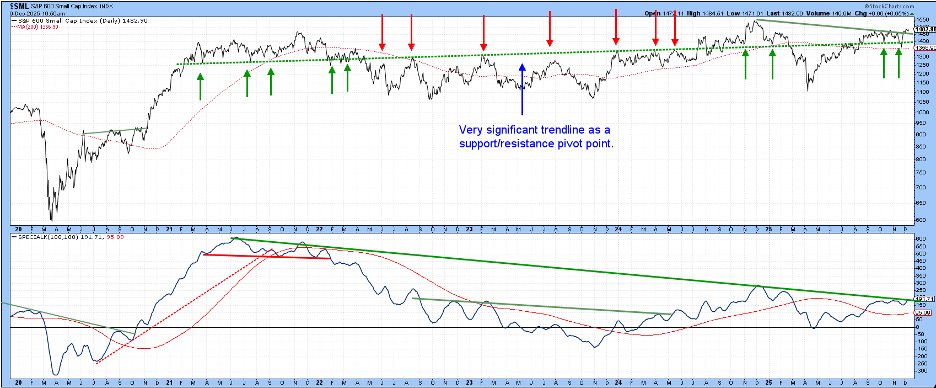
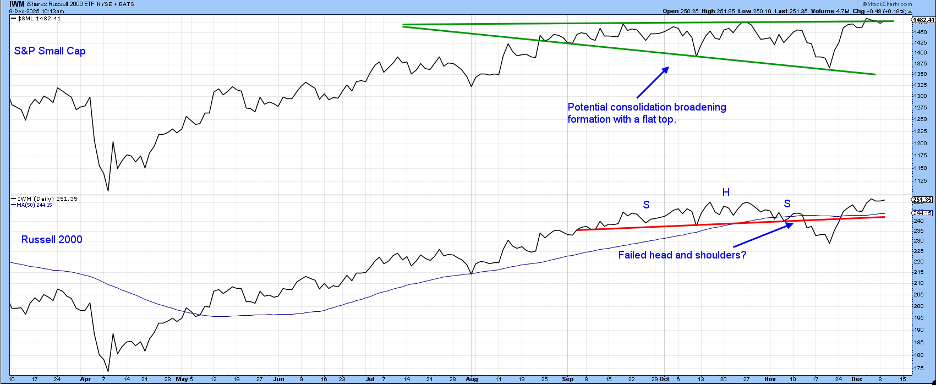
Finally, Chart 5 features recent action for $SML and IWM. Action in the S&P Small Cap ETF is particularly interesting since it could be in the terminal phase of tracing out a broadening formation with a flat top. The flat top refers to the almost horizontal resistance trendline, and the broadening part to the declining trendline joining the three successively lower lows. The broadening part emphasizes that, at each successive low, more traders get stopped out. That’s important because it clears the market for a strong take-off if prices break decisively above the resistance trendline. The completion of a right-angled or broadening pattern is often followed by an above-average move, more so than if the price retreats from current levels and then breaks out. Under such a scenario, the correction would represent the right shoulder of an inverse head-and-shoulders formation. That would still be bullish, but not as explosive as the completion of a broadening formation.
The IWM, on the other hand, has already experienced a failed head-and-shoulders top and needs to move more decisively above the “head”. Such failed patterns are often followed by above-average price movements as traders, thinking the downside break was valid, are forced to get back on the right side of the market.
The Bottom Line
It hasn’t completely happened yet, but it seems likely that the small-cap sector may be setting itself up for an upside breakout. Equally important is the possibility that the long-term decline in the RS line could be experiencing a change in trend, either from down to sideways or from down to up.
Good luck and good charting,
Martin J. Pring
The views expressed in this article are those of the author and do not necessarily reflect the position or opinion of Pring Turner Capital Group of Walnut Creek or its affiliates.


