Is It Time to Think Small in a Big Way?
Multi-year swings in the ratio between the NYSE and S&P 500 Composite typically indicate changes in sector leadership and investor sentiment across the broad stock market, as compared to its large-cap subset. When this relationship rises, it usually means NYSE-listed stocks, including many international companies and sectors with less representation in the S&P, are outperforming the mega-cap focused S&P 500. The NYSE also includes small- and mid-cap issues, which tend to prosper when the ratio is advancing.
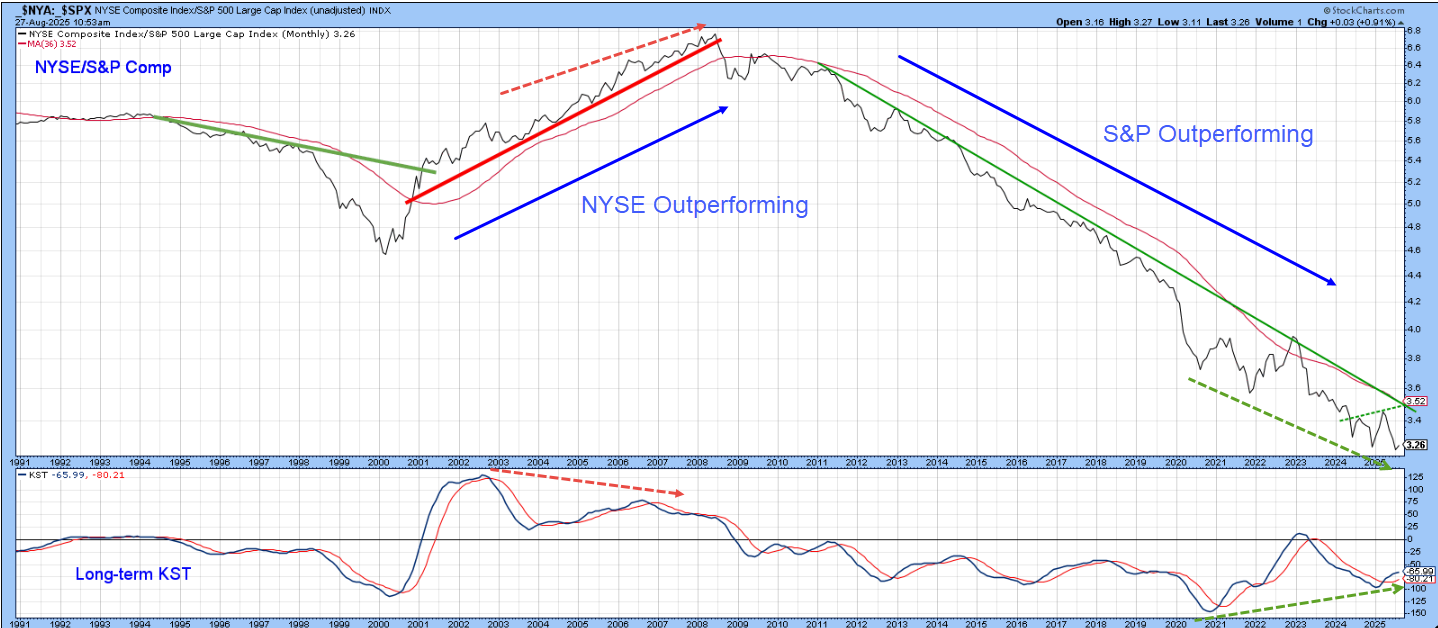
I’m going to get to small-caps later, but, for now, let’s focus on Chart 1, which shows the NYSE/S&P ratio has experienced three multi-year swings since 1991. The most recent downtrend began in 2008 and is now in its seventeenth year. That’s an awfully long time, especially for financial markets. Consequently, it’s not unreasonable to look for evidence suggesting that a reversal is underway and a favorable environment for small-caps emerging.
In that respect, we see a recently minted buy signal for the long-term KST. On the face of it, that’s nothing to get excited about, since there have been many false KST dawns since 2008 due to the dominance of the secular downtrend. However, that condition may be in the process of changing, since the green dashed arrows highlight a 4-year positive divergence, not unlike the negative one that preceded the 2008 top.
Divergences, of course, only indicate under-the-surface strength or weakness and require some kind of trend reversal signal as confirmation. In that respect, the chart offers us a really good benchmark at around 3.5, which is where the two trendlines and the 36-month MA are currently residing.
Another key benchmark to monitor is a positive zero crossover by the PPO using the 6- and 15-month parameters, displayed in Chart 2. Since 2008, this approach has triggered two false signals which were basically break-even. Otherwise, it has successfully sidestepped the secular downtrend. A positive zero crossover would likely signal a major reversal, but we may have to wait, as there are few signs the PPO is about to cross the magic zero level any time soon.

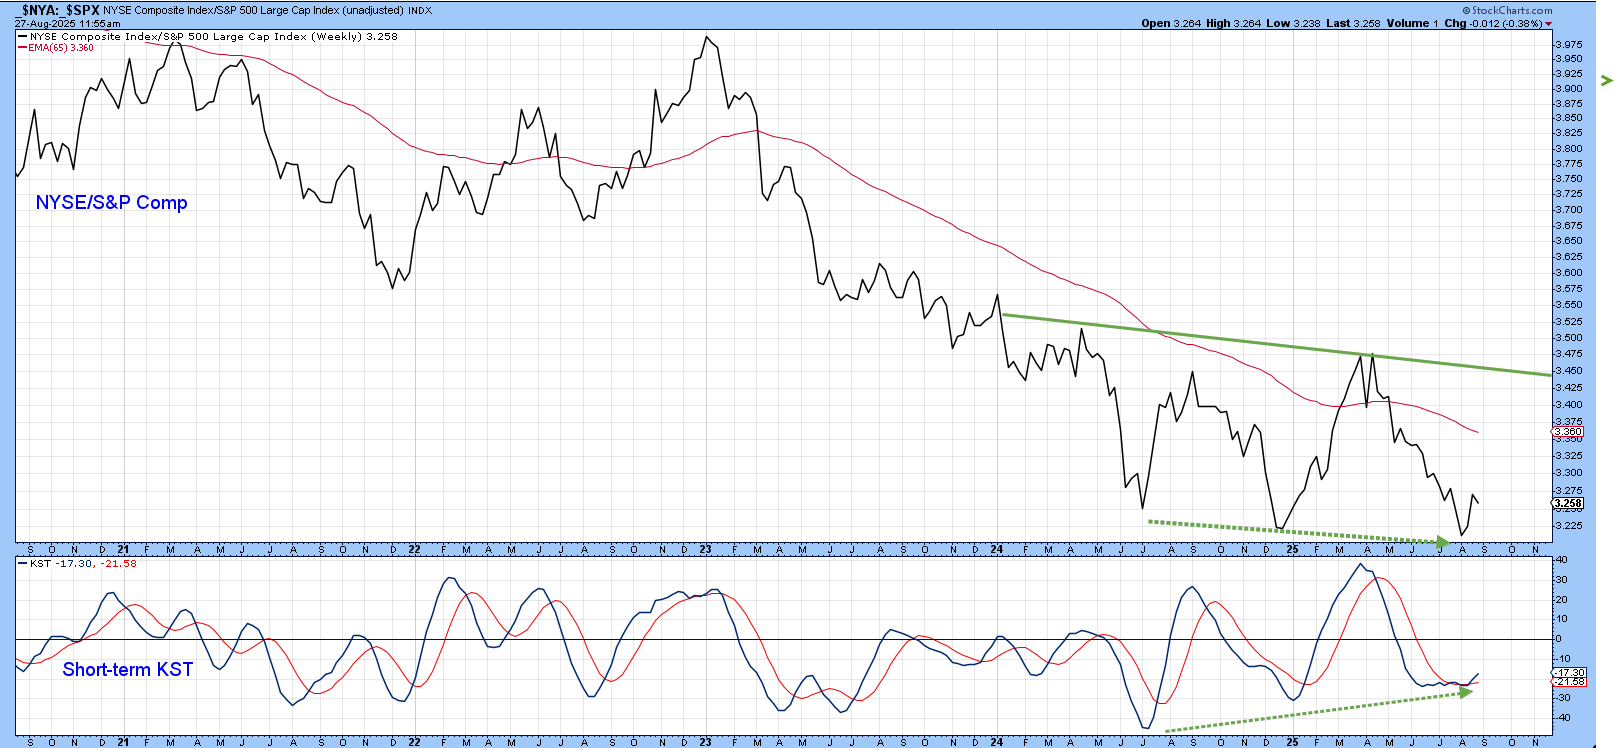
Chart 3 highlights a potential base that would be completed with a decisive break above the green trendline, which is currently around 3.5. However, a worthwhile attempt is likely. That’s because the short-term KST has been positively diverging with the ratio since last year, as flagged by the green dashed arrows.
Small Cap vs. Large Cap
Chart 4 compares the small cap Russell 2,000 to the S&P Composite. It peaked in 2011. Like the NYSE/S&P relationship, it has been trending lower ever since. There is little in the chart to get excited about at the moment, since the ratio is below both its down trendline and 12-month MA. The KST is also bearish, but has recently moderated its downward trajectory, thereby indicating a more finely balanced picture. That opens up the possibility a small rally could tip the balance and trigger a significant rally.
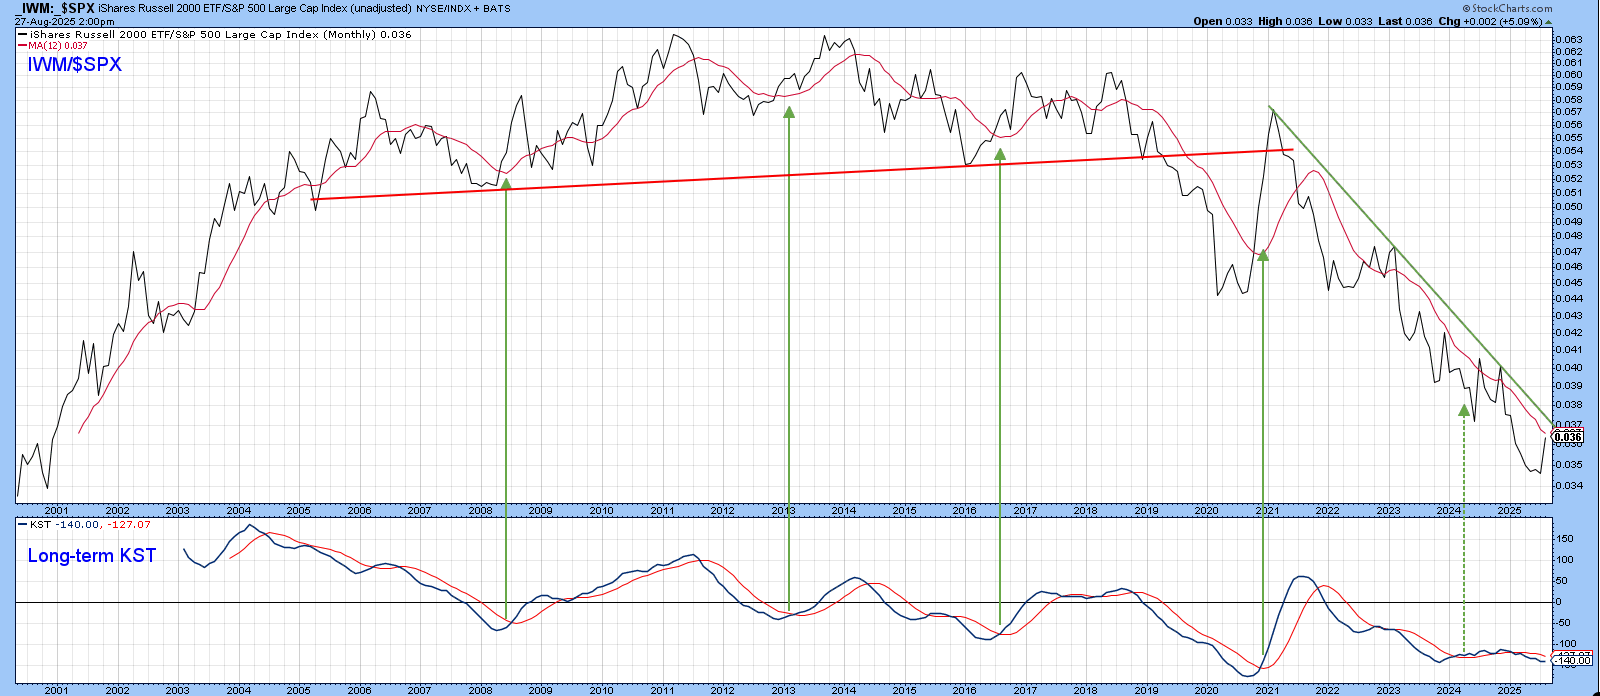
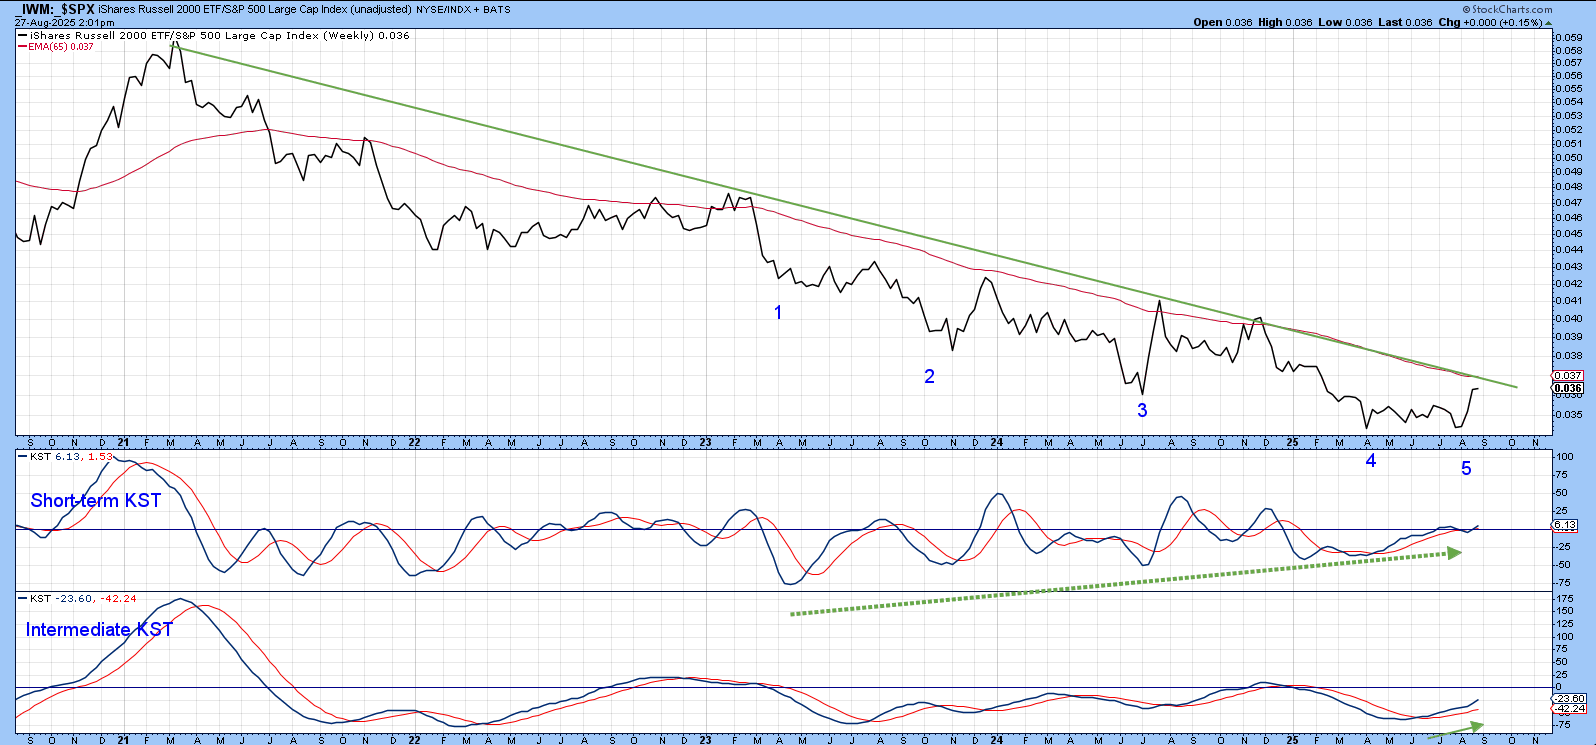
Chart 5 reproduces the 2021-2025 monthly down trendline displayed in the previous chart in weekly format. Three things are worth noting. First, the distance between the ratio and the trendline is substantially reduced from that in Chart 4. Second, the ratio has been tracing out a pattern of lower lows since 2023, compared to the short-term KST, which has experienced a series of rising ones. Third, the short-term KST is positive, as is its intermediate counterpart.
This is a great momentum setup, as it implies a very strong rally for the ratio, but only if the down trendline and 65-week EMA are decisively surpassed on the upside.
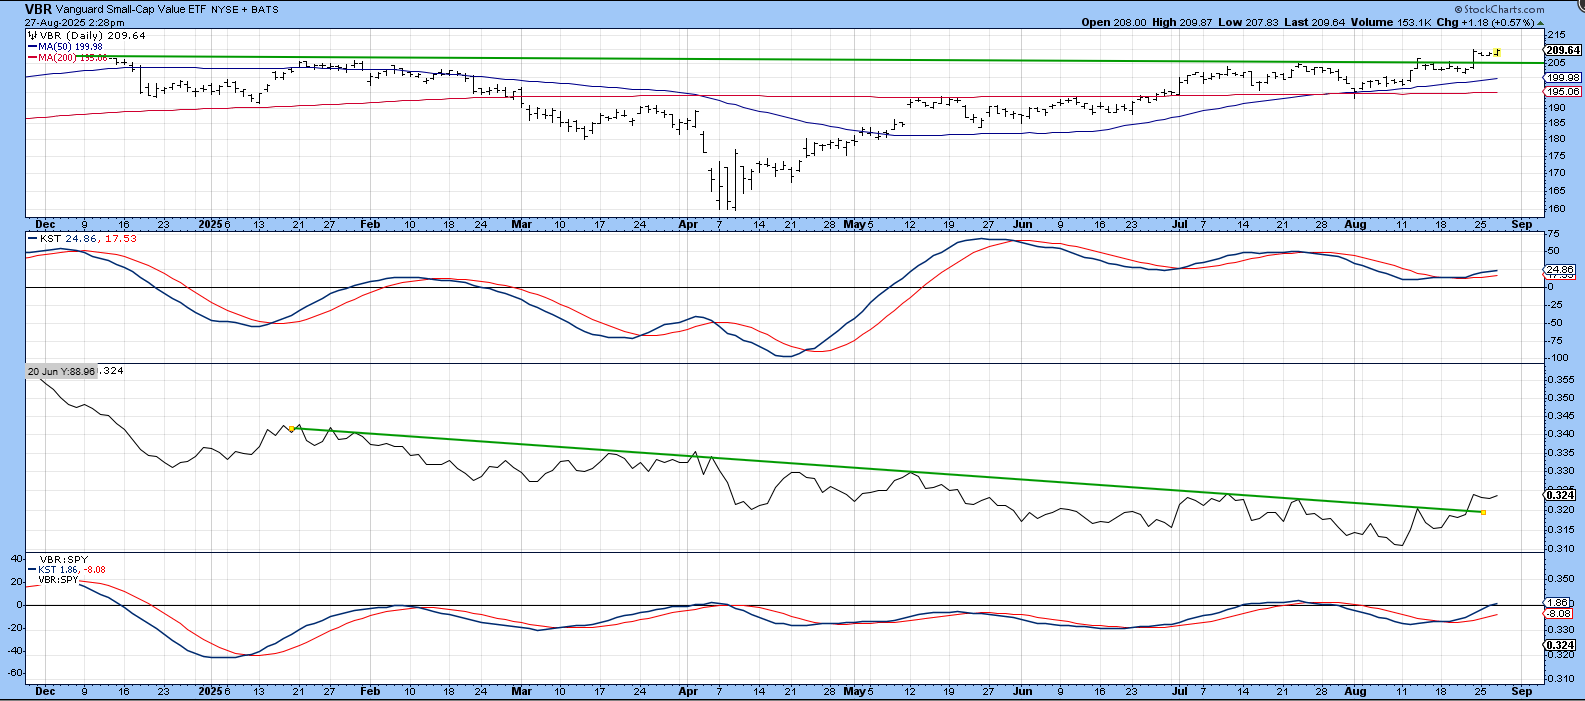
Two ETFs stand out as possible small-cap leaders. The first is the Vanguard Small Cap Value (VBR). Chart 6 shows that it has already broken out on the daily charts with improving relative action.
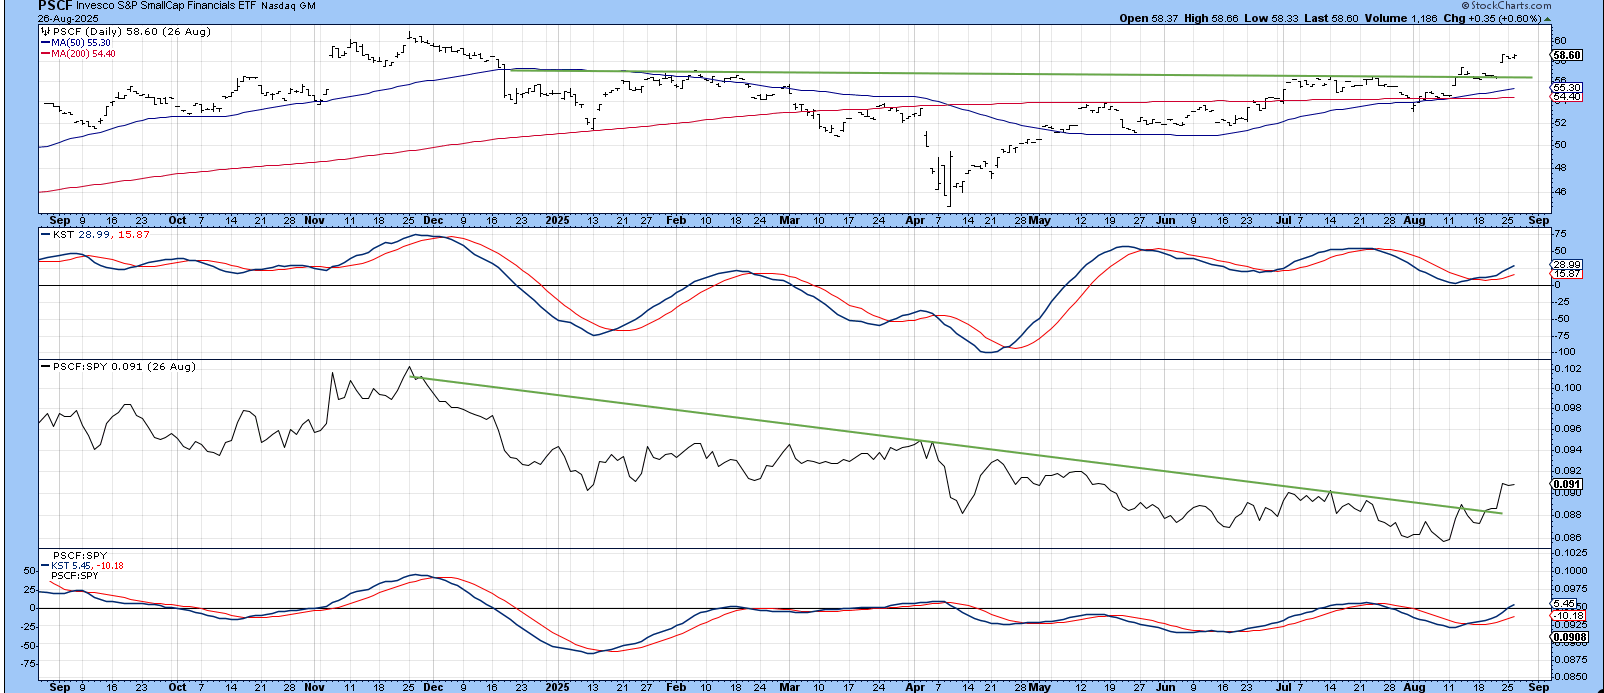
The Invesco Small Cap Financials (PSCI) also looks promising, having experienced healthy breakouts and positive momentum.
Conclusion
When the ratio between the NYSE and S&P Composites rallies, it indicates a broadening participation that usually embraces small-caps. At the moment, the downtrends for both the NYSE/$SPX and IWM/$SPX are intact. Nevertheless, they should be monitored for a potential reversal, as that would probably be associated with the resetting of many relative sector relationships.
Good luck and good charting,
Martin J. Pring
The views expressed in this article are those of the author and do not necessarily reflect the position or opinion of Pring Turner Capital Group of Walnut Creek or its affiliates.


