Is the Market About to Turn? Key Charts Every Investor Should Watch Now

Key Takeaways
- Market sentiment is uneasy but not bearish, with several breadth indicators holding above key thresholds.
- NVDA's strong earnings may help stabilize the market, but uncertainty about jobs data could push stocks lower.
- Stocks fall fast, so use key technical charts and your investment time horizon to guide decisions.
If you’ve watched your portfolio shrink a bit over the last few days, you’re not alone. When this happens, it’s natural to feel uneasy. After months of steady gains, any significant pullback can rattle even seasoned investors. So when the S&P 500 ($SPX) finally closed higher on Wednesday by 0.38%, after four consecutive down days, it probably felt like a small-but-welcome sigh of relief.
And while this was happening, perhaps you debated selling a few positions but hesitated because, well… maybe NVIDIA will save the day. So, with that in mind, how did NVIDIA (NVDA) do?
NVDA Comes Through, But Is It Enough?
NVDA beat Wall Street earnings expectations and offered strong guidance for the next quarter. But here's the big question: is that enough to lift investor confidence and move the broader market higher?
It’s been a shaky week for the S&P 500. The index broke below its 50-day Simple Moving Average (SMA) and came close to hitting its 100-day SMA.
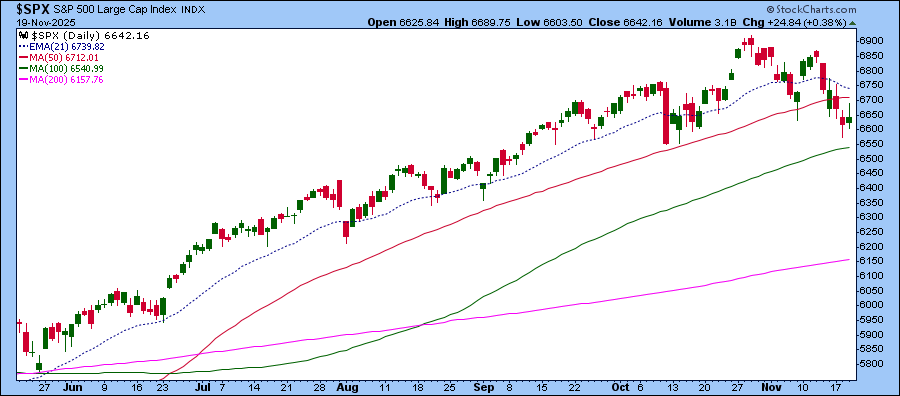
Wednesday started strong, but stocks sold off and remained choppy for most of the day. At the close, not much changed in the broader market. Even gold and silver, often considered safe havens, followed a similar pattern.
To add to the uncertainty, the Bureau of Labor Statistics announced that it wouldn’t be releasing the full October jobs data on Thursday. This made investors more jittery. The odds of a December rate cut have dropped sharply to around 34%, down from over 90% just a couple of weeks ago.
What Are the Charts Whispering?
While investor sentiment has cooled, it hasn’t moved firmly into bearish territory. Let’s look at a few breadth and sentiment indicators as of Wednesday’s close.
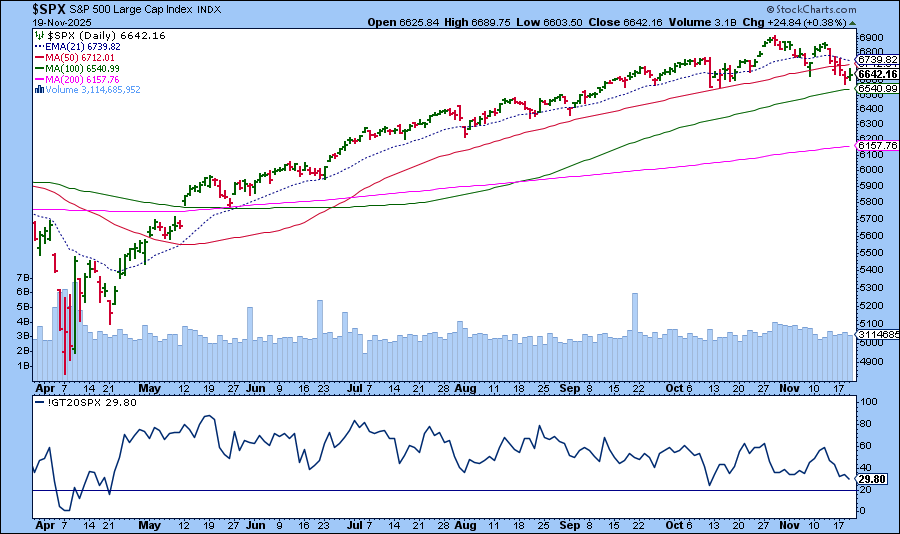
Percentage of S&P 500 stocks trading above their 20-day EMA (lower chart panel). It’s around 30%, which is close to the October 10 level.
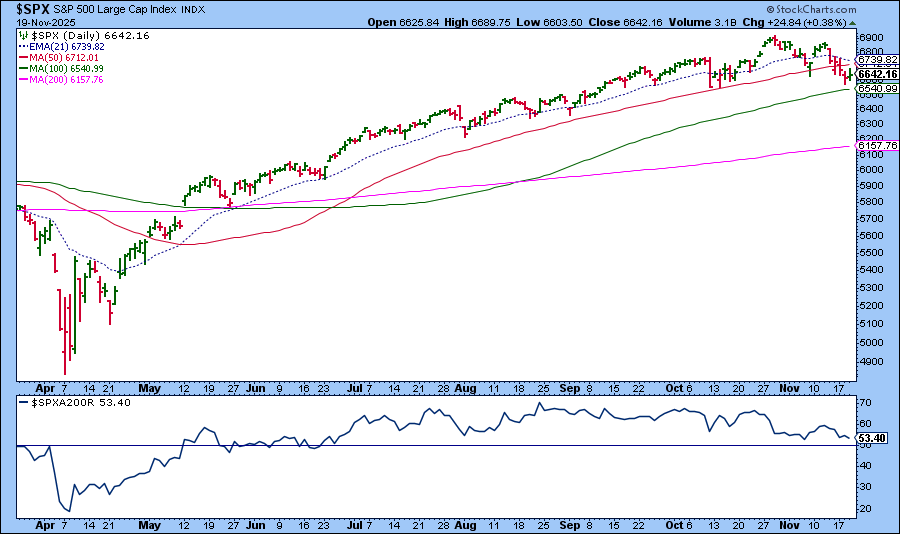
Percentage of S&P 500 stocks trading above their 200-day SMA. It’s around 53%, holding above the 50% line.
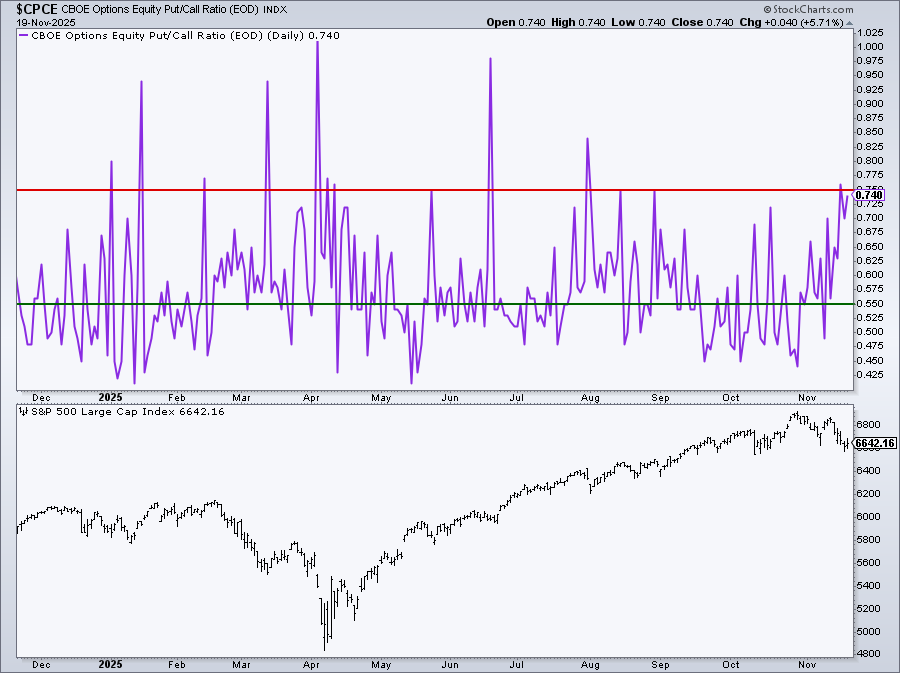
Cboe Options Equity Put/Call Ratio. Drifting higher as the S&P 500 turned lower, a sign of growing caution. A higher put/call ratio means investors are hedging their portfolios. The ratio is very close to the 0.75 threshold.
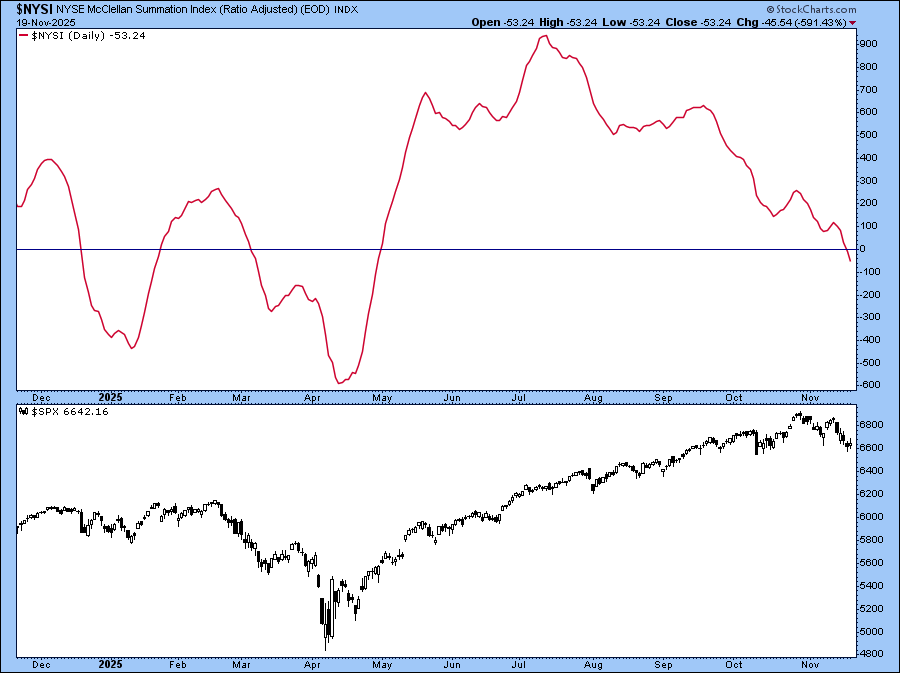
NYSE McClellan Summation Index ($NYSI). It has fallen below zero, which indicates overall market breadth is weakening.
Taken together, these charts tell us that investor sentiment isn’t overly bullish or bearish. It’s more of an indication that the market is trying to make up its mind. NVDA’s strong earnings report might nudge sentiment in a positive direction but, if investors dislike the partial jobs data, we could see the market quickly slide lower.
One takeaway from this week is that stocks fall a lot faster than they rise. It’s a good reminder to keep your emotions in check and rely on a disciplined process.
Your Action Plan
Regardless of which direction the market goes, it’s a good idea to save these charts to your ChartLists and use them to help guide your decisions.
You may have short-term trades and longer-term positions. Just remember that your definition of “short-term” and “long-term” may be very different from someone else’s. The key is knowing your comfort level and sticking to it. Markets will move up and down, but having a plan and the tools to follow it can make all the difference.
Disclaimer: This blog is for educational purposes only and should not be construed as financial advice. The ideas and strategies should never be used without first assessing your own personal and financial situation, or without consulting a financial professional.


