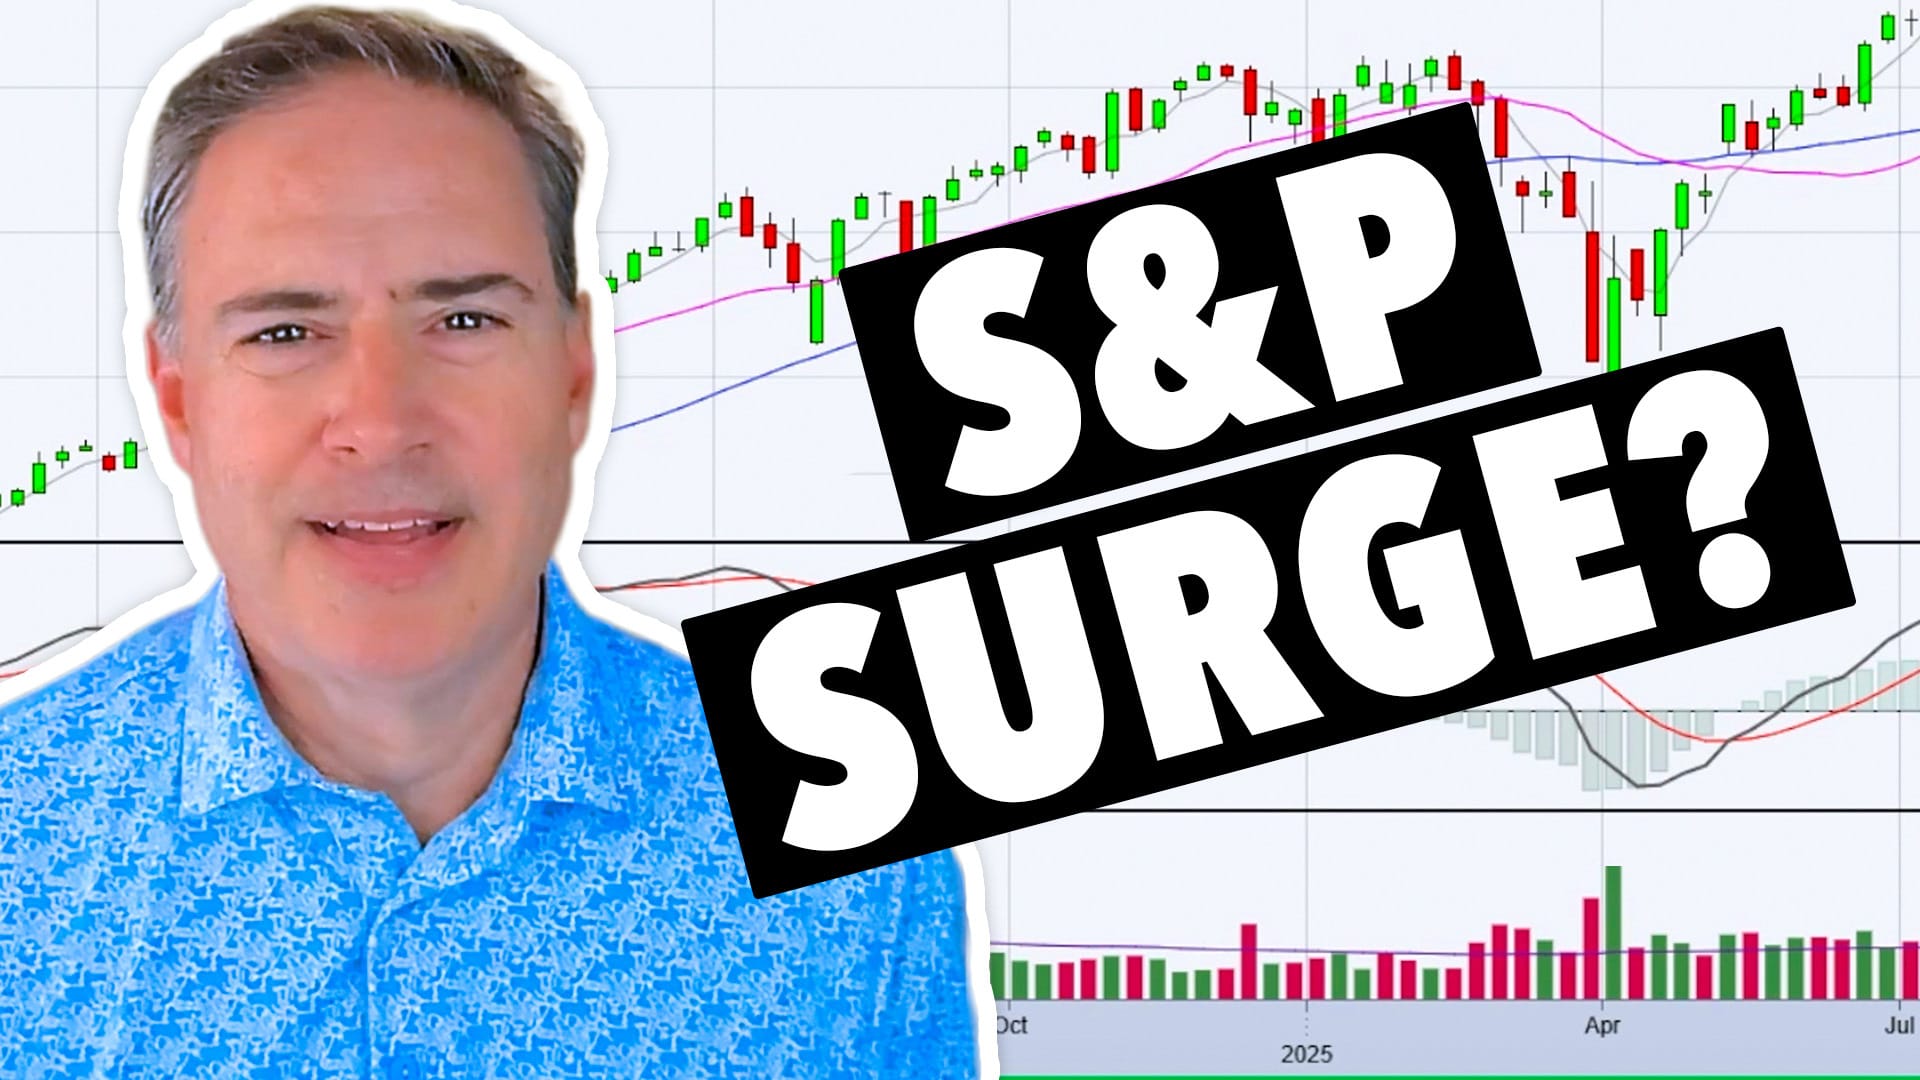
Is the S&P 500 About to Surge?

Joe analyzes the S&P 500’s current sequential wave pattern and, from there, explains how to spot a shift into a surging market phase. He breaks down key support and resistance levels on the SPY daily chart, evaluates the QQQ and IWM for signs of market strength, and identifies individual stocks with strong momentum and pullback setups. In addition, Joe reviews viewer requests, highlighting chart patterns, technical signals, and trade management tips you can use right now.
The video premiered on August 13, 2025. Click this link to watch on Joe's dedicated page.
Archived videos from Joe are available at this link. Send symbol requests to stocktalk@stockcharts.com; you can also submit a request in the comments section below the video on YouTube. Symbol Requests can be sent in throughout the week prior to the next show.


