It’s That Time in the Cycle for Materials; Do the Technicals Agree?

The business cycle is nothing more or less than a set series of chronological sequences. It starts with the Fed throwing money at the economy with the objective of driving interest rates lower. That action encourages new home purchases and additional construction. Those houses have to be furnished; in turn, this spending encourages manufacturers of consumer durables to expand their plants and equipment.
It’s not surprising, therefore, that investors begin the stock market cycle by emphasizing interest-sensitive and defensive sectors such as Consumer Staples and Health Care, only later turning their attention to companies that benefit from strong capital spending and firm commodity prices.
My economic work suggests we are currently positioned at the late stage of the cycle that benefits the mining, energy, and basic industry sectors, but what are the technicals saying?
SPDR Materials Sector
Our first chart features the Materials Select Sector SPDR Fund (XLB) on a long-term basis. It is tentatively breaking above a resistance trendline. I say “tentatively” because this is a monthly chart. Unfortunately, we have to wait until next week to see whether the end-of-the-month closing price agrees.
It is also evident that the long-term KST has crossed marginally above its nine-month MA for its ninth buy signal since the turn of the century.
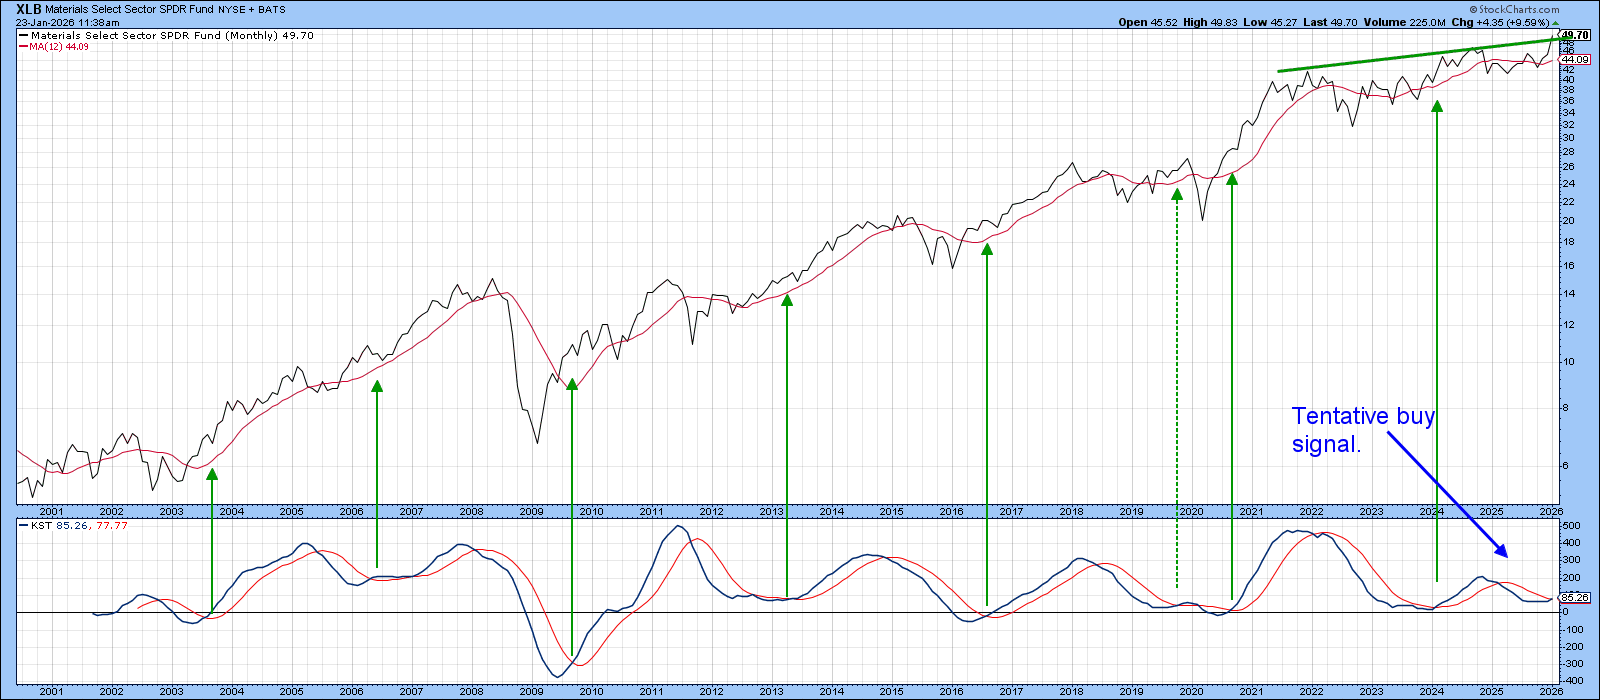
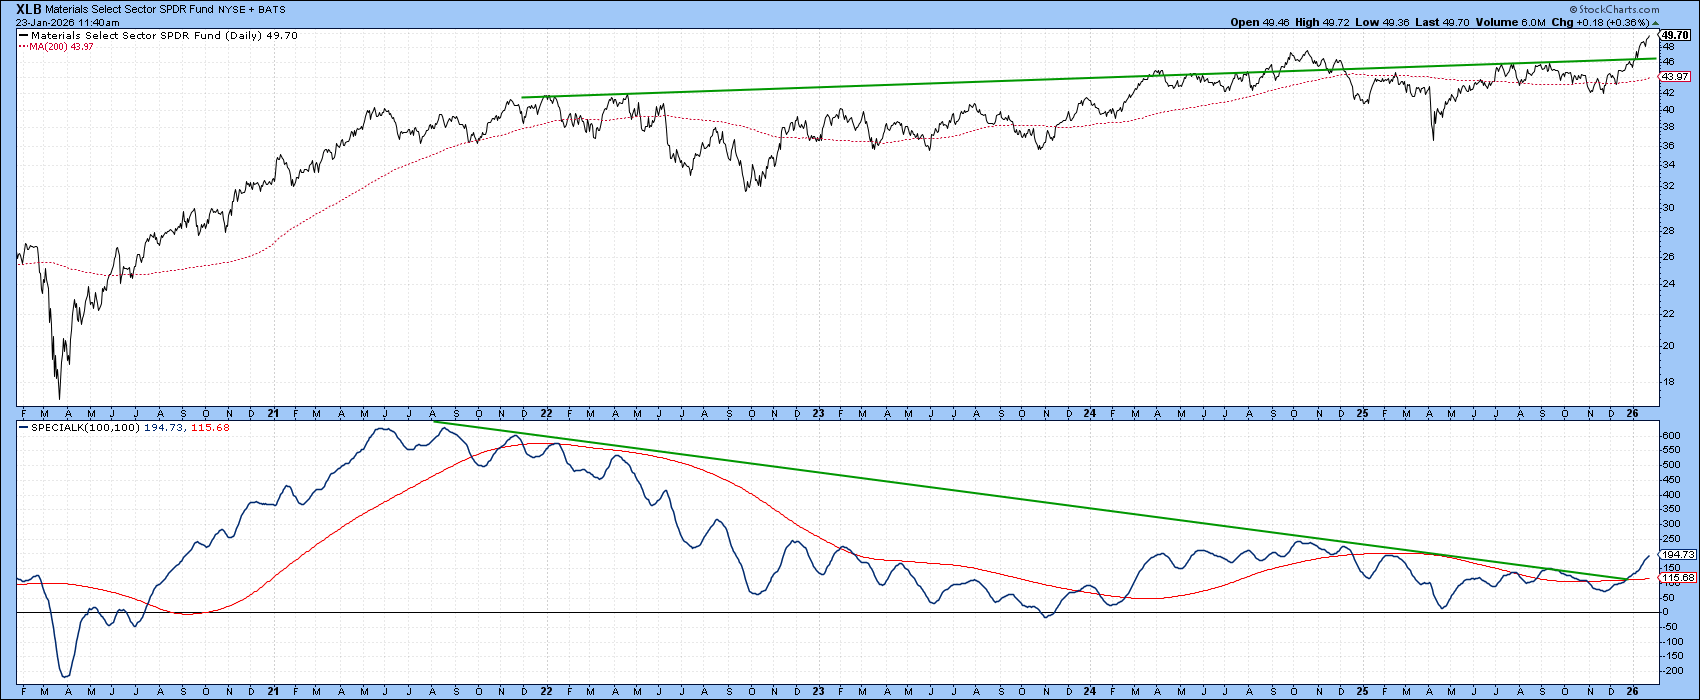
Chart 2 plots daily data and reflects a much stronger breakout, as the price has surpassed its resistance trendline emanating from late 2021. The most impressive action, though, comes from the Special K (SPK), which you can read about here.
This indicator is constructed by combining short-, intermediate-, and long-term rates of change into a giant, jagged momentum indicator that reflects swings in the primary trend. When it is possible to construct a trendline lasting six months or more, its violation is typically followed by a bull or bear market in the price series being monitored.
Chart 2 displays such a setup. It also reveals the SPK has crossed decisively above its signal line.
I alluded earlier to the fact that sectors such as Materials underperform at the beginning of the cycle and post their best relative performance towards the end of it. Chart 3 demonstrates this point well, as the XLB RS line had been in a declining trend since late 2022. Now, though, it has surpassed its bear market trendline and 200-day MA. The SPK for relative action has also violated its down trendline and crossed its signal line.
Most impressive of all, and perhaps least appreciated, is the 20-year high in the daily KST in the bottom window. On the one hand, there can be no doubt that it’s an overbought reading, which increases the odds of a correction. On the other hand, the achievement of a 20-year high in relative momentum is a sign of an extremely young and vibrant bull market and, therefore, a reversal of the previous downtrend.
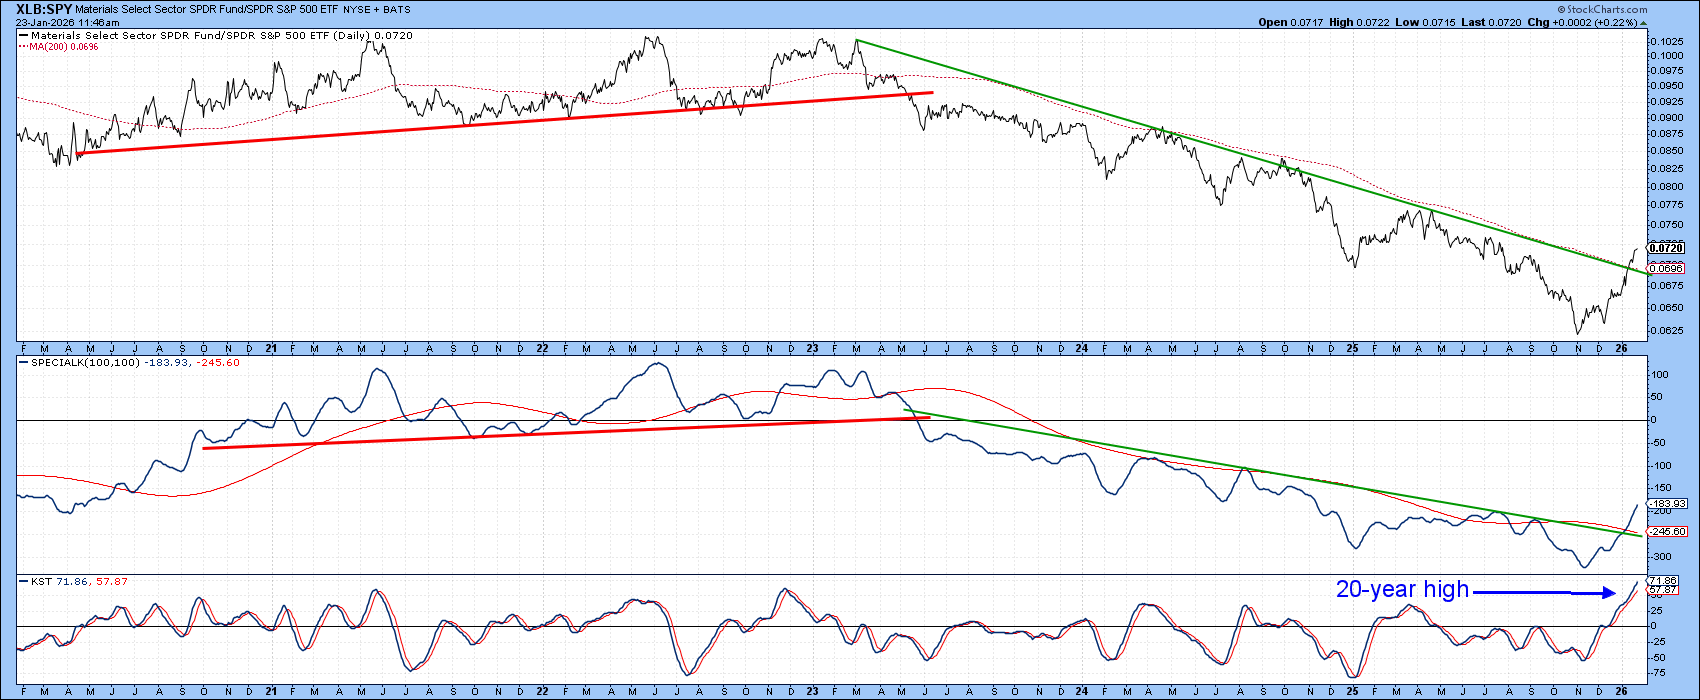
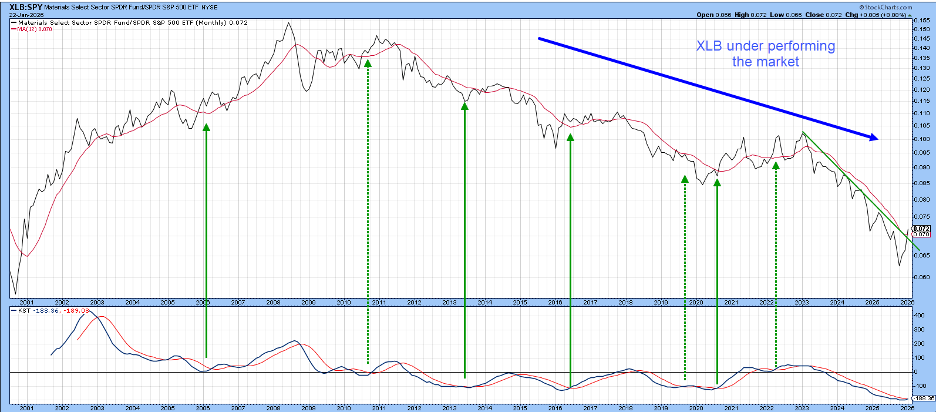
Chart 4 shows that a turnaround in relative performance has the potential to be a big deal. That’s because the downtrend featured in Chart 3 is revealed as the latest down leg in relative action from a trend that began way back in 2008. At this point, the RS line has surpassed its down trendline and 12-month MA. That’s the first positive MA crossover since 2023. Note also that the KST is within a fraction of a buy signal.
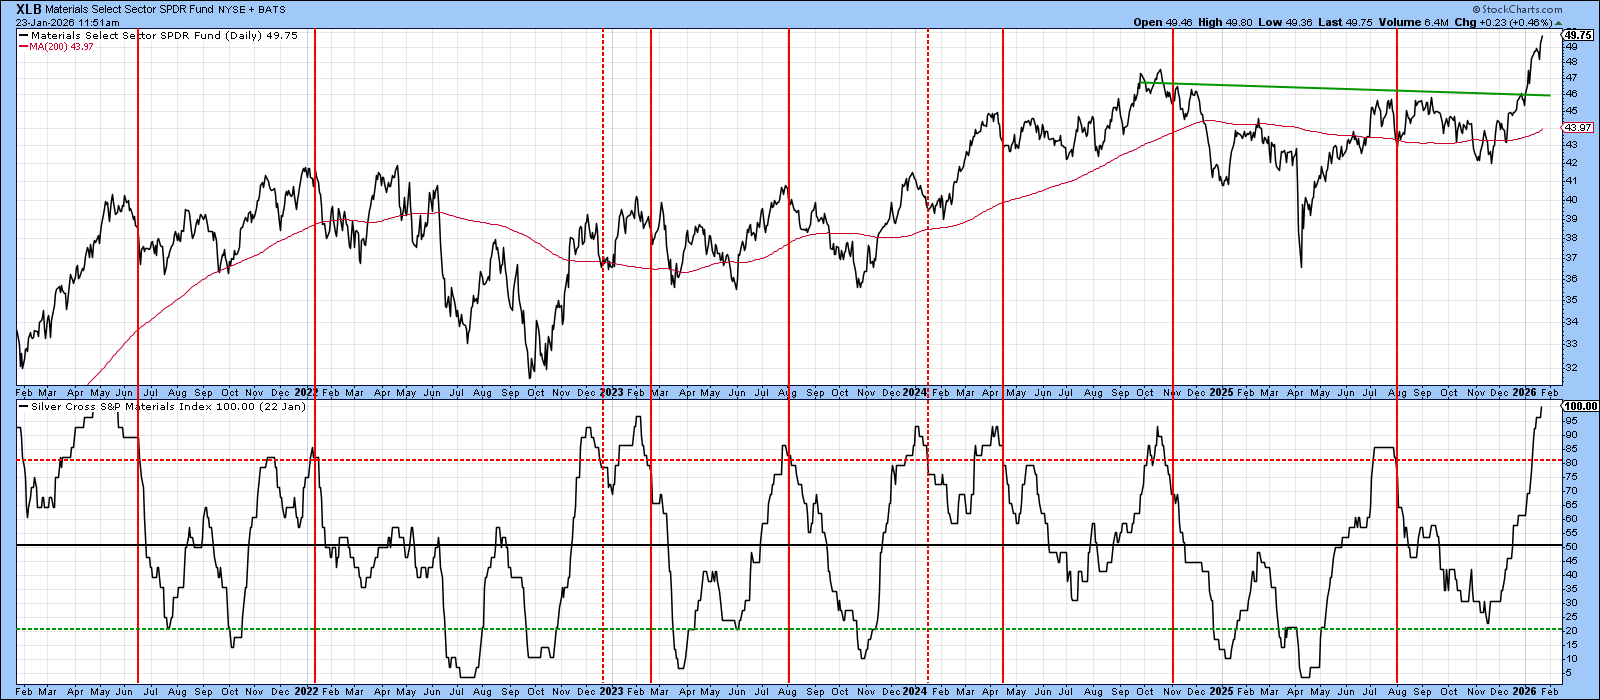
While my interpretation of the technicals argues in favor of higher prices for the XLB, Chart 5 cautions against rushing in. That’s because the percentage of XLB components experiencing a 20-day EMA above its 50-day counterpart (Silver Cross) has reached the overstretched zone. The vertical lines identify periods when the oscillator exceeds the red-dashed overbought zone and then re-crosses it on its return towards equilibrium. A short-term decline usually transpires.
In a bull market, it’s possible for this indicator to remain overstretched for an extended period. This chart merely throws up a yellow card and suggests that any correction is likely to represent a buying opportunity.
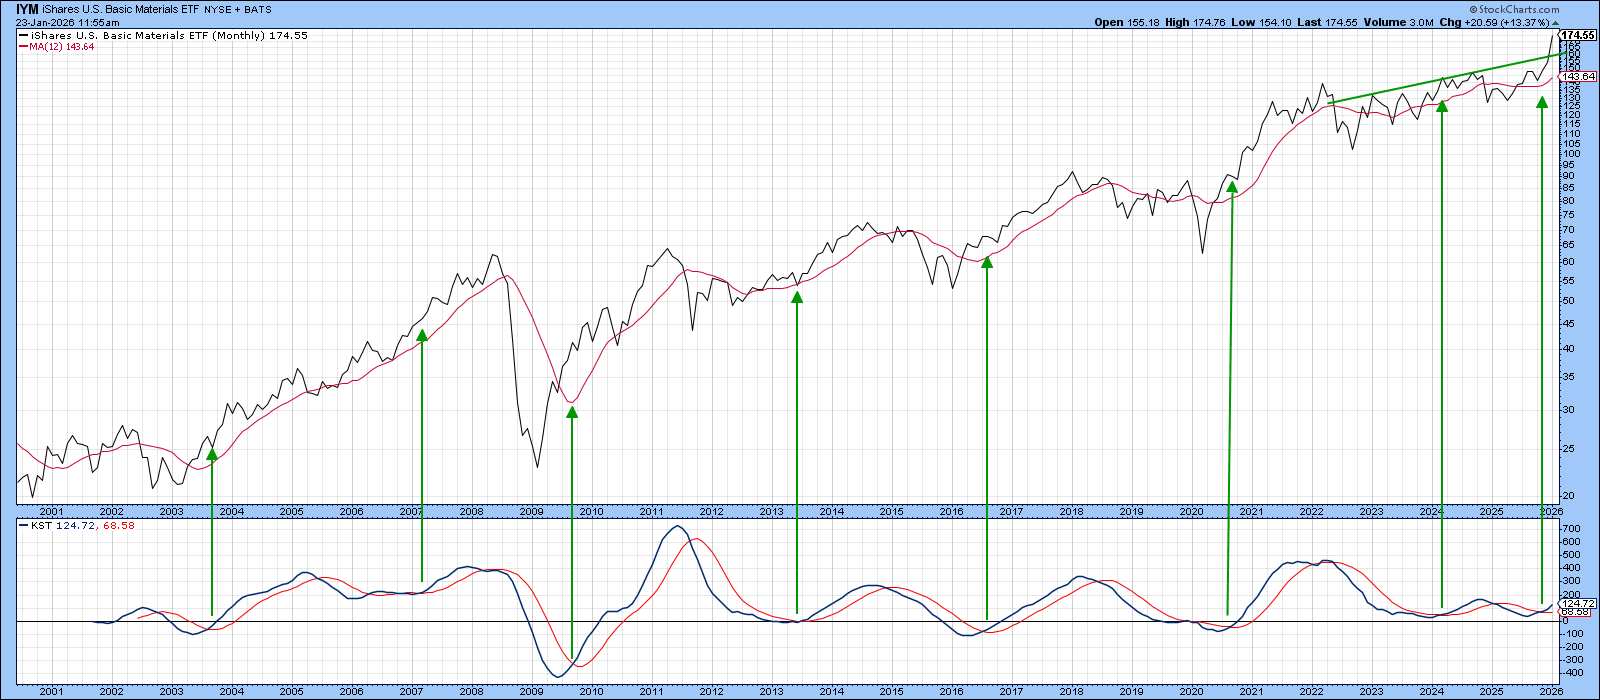
Finally, we tend to focus on the SPDR sector-based ETFs because the StockCharts platform provides us with a wealth of internal sector indicators, such as the silver cross series in Chart 5. However, Dow Jones also provides sector indexes with slightly different orientations. In that regard, Chart 6 shows that the iShares U.S. Basic Industries (IYM) has triggered a decisive KST buy signal and broken far more decisively above its former resistance trendline and MA than the XLB (see Chart 1). The reason is that this ETF contains a larger exposure to mining stocks, which have been performing well recently.
Good luck and good charting,
Martin J. Pring
The views expressed in this article are those of the author and do not necessarily reflect the position or opinion of Pring Turner Capital Group of Walnut Creek or its affiliates.


