Jackson Hole 2025: Investors Stay Calm as Bond Volatility Hits Lows
Key Takeaways
- The MOVE Index of Treasury volatility has sunk to its lowest level since early 2022.
- With Powell’s Jackson Hole speech on tap, the IG credit spread is near cycle tights.
- The 10-year yield is in the spotlight, with one key technical pattern key to the next move.
There’s something for everyone this week. Geopolitical intrigue is high as Ukrainian President Volodymyr Zelenskyy meets with President Trump at the White House, with European leaders on hand. The focus then shifts to retailer earnings mid-week, just after the US average effective tariff rate ratcheted up to 18.6% earlier this month.
Then it’s all about the Fed. The Jackson Hole Economic Symposium gets underway Thursday, with Fed Chair Powell’s annual address on Friday at 10 a.m. ET. Before that, minutes from the July FOMC meeting hit the tape at 2 p.m. ET Wednesday, with plenty of Fed speak before and after.
Muted Bond Volatility
Amid so many macro variables and tells on the consumer in the immediate offing, you might think that volatility would be on the upswing. That’s not the case. The Cboe Volatility Index ($VIX) is calm, near 15, while the Treasury volatility gauge, the ICE MOVE Index ($MOVE), has fallen under 80.
Bond aficionados are probably familiar with MOVE, but it may be new to stock traders. It's basically the VIX of the Treasury interest rate market; I like to plot it alongside the VIX on StockCharts. It's also a handy chart to save in advance of key Fed events such as Jackson Hole.

A Look At Credit Spreads
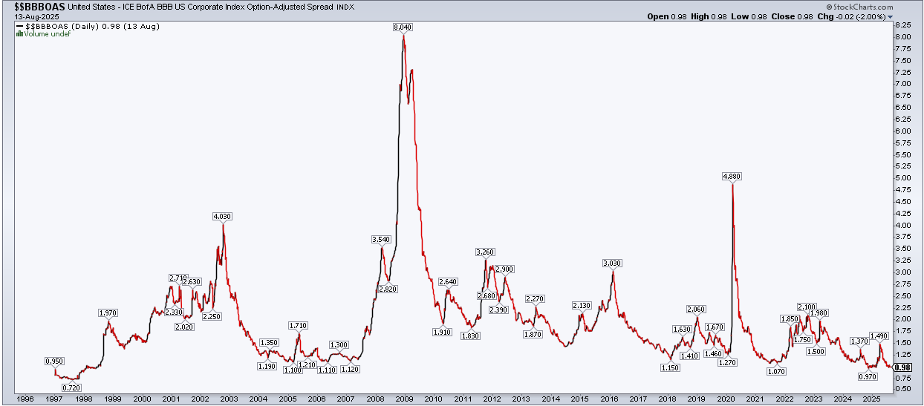
But the MOVE isn’t the lone calm fixed-income barometer right now. In recent sessions, investment-grade credit spreads have sunk toward the tightest this century. Fear is largely absent from the bond space, and these good vibes come after what was a stellar Q2 earnings season.
The BBB US Corporate Option-Adjusted Spread is near cycle tights at 98 basis points as of August 13. A couple more ticks lower, and it would be at the softest spread going back to 1998. You can view this chart, along with the high-yield spread, on the StockCharts Market Summary.
The mood leading into 2025’s Jackson Hole Economic Symposium is less upbeat compared to last year. Recall that 12 months ago, Powell used the event to tee up its first rate cut of the cycle. It would turn out to be a jumbo 50-basis-point slash to the policy rate, amid concerns that the July 2024 jobs report was a harbinger of a sharper labor-market slowdown. Sound familiar?
The difference between now and then is that inflation is a bug-a-boo. There is no cushion to cut half a point this go-round, with the PCE inflation rate rising from 2.2% year-on-year in April to 2.6% in June. Rising core goods costs, likely impacted by tariffs, have boosted consumer prices. Moreover, last week’s wholesale price report (the PPI) was hot on all accounts.
As it stands, there’s an 85% implied chance of a quarter-point Fed rate cut to come on September 17. Much hinges on how Powell frames the policy outlook this Friday.
Still, conditions are far better than they were three years ago. A short and sour eight-minute Jackson Hole missive stunned economists and traders alike in 2022. Stocks would go on to plunge that session, eventually bottoming two months later. Treasury yields popped, as it was clear that the only path toward normalizing inflation was for the FOMC to lift its policy rate further.
But let’s zoom out. Take a look at the 10-year Treasury yield chart below. It has been a series of lower highs and higher lows for the better part of the past two years. Technicians lick their chops with these kinds of patterns, with all eyes on either a breakout or breakdown.

Old-school analysis augurs for a breakout in the trend of a larger degree: higher. If that were to play out, then a measured move upside price objective to about 6% would be in play for the 10-year. That’s calculated from taking the 1.5 percentage point range at the start of the coil and adding that onto the presumed breakout point, perhaps near 4.5%. These levels should not be taken as gospel; rather, they offer clues on the potential magnitude of the next leg.
Of course, a breakdown below the April 4 low, and Treasury bulls would be in charge (yield down, price up).
The Bottom Line
The bond market is crickets heading into a critical week of news on the Fed front. Not only do we hear from Powell on Friday, but FOMC minutes will provide insight into discussions at the July meeting (which featured two dissenting votes for the first time in more than 30 years), and noted doves Waller and Bowman are among the Fed speakers in the days ahead.
Investors must heed price action. Interest rates and volatility levels will likely move ahead of whatever policy shifts are announced. For now, the bond backdrop appears as calm as those Grand Teton vistas.


