Large-Cap Dominoes are Falling; XLF Joins the Fray; Money Moves into Utes and Bonds
Key Takeaways
- The large-cap-dominated S&P 500 is struggling. The dominoes are falling as MAGS, QQQ, and XLK break.
- SPY is testing its benchmark low as Financials plunge.
- Utilities and bonds are picking up the slack.
The dominoes continue to fall within the large-cap tech universe as QQQ breaks a benchmark low. Weakness is spreading into the broader market as Financials (XLF) plunge and SPY tests first support. Meanwhile, money is moving into safe-haven bonds and defensive utilities.
Equal-Weight S&P 500 Leads Large-Cap S&P 500
Chartists can use benchmark highs and lows to compare performance and identify trend signals.
The chart below shows the Invesco S&P 500 Equal Weight ETF (RSP) in the top window and the SPDR S&P 500 (SPY) in the lower window. Where SPY represents large-caps, RSP represents the "average stock" in the S&P 500, thus reflecting the broadening trade TrendInvestorPro has been following since the late November breakouts.
The October high marks a benchmark high (pink line), which is a high we can use to compare charts. RSP broke this high and recorded a 52-week high in mid-December. The ETF extended higher with new highs in January and February. RSP is clearly leading, which means the average S&P 500 stock is outperforming.
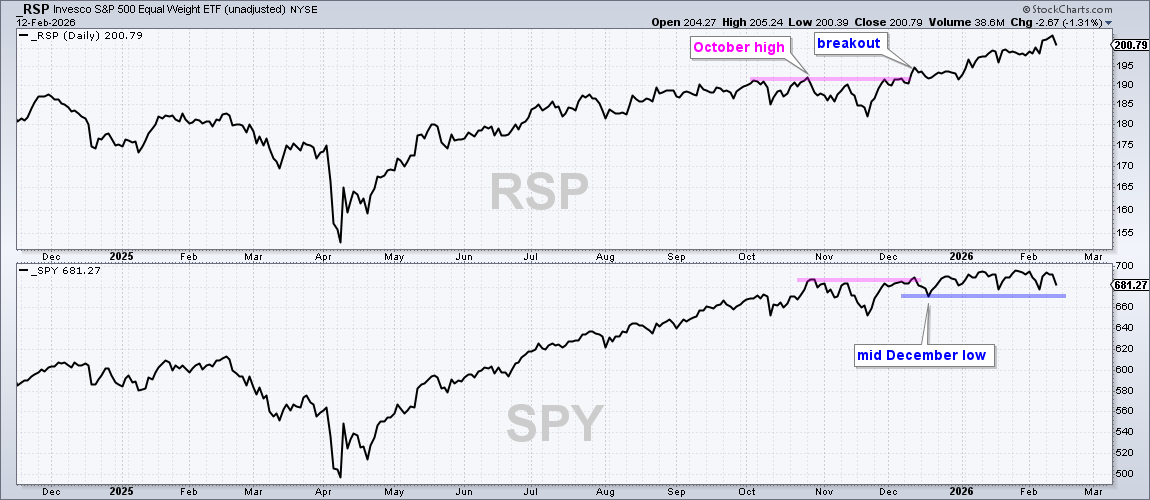
SPY also broke out and recorded a 52-week high in mid December. However, it struggled to extend on this breakout as it traded above/below the breakout level. The inability to follow through means large-caps are struggling. There was a dip into mid-December and then a rebound towards 700. This mid-December low now marks a benchmark low (blue line), which I can use to compare performance.
Dominoes Falling as MAGS, QQQ, and XLK Break
The point where the dominoes started falling was when the Roundhill Big Tech ETF (MAGS) broke the mid-December low on January 14th. Working from left to right, we can see a breakdown in late February 2025 and a big bullish breakout in mid-May. MAGS extended higher into October, then stuttered. Initially, it failed to break the October high and formed a lower high in December; from there, it broke the mid-December low. This was the first domino to fall. MAGS went on to break the October–January lows on Wednesday, reversing the uptrend and signaling the start of a new downtrend.
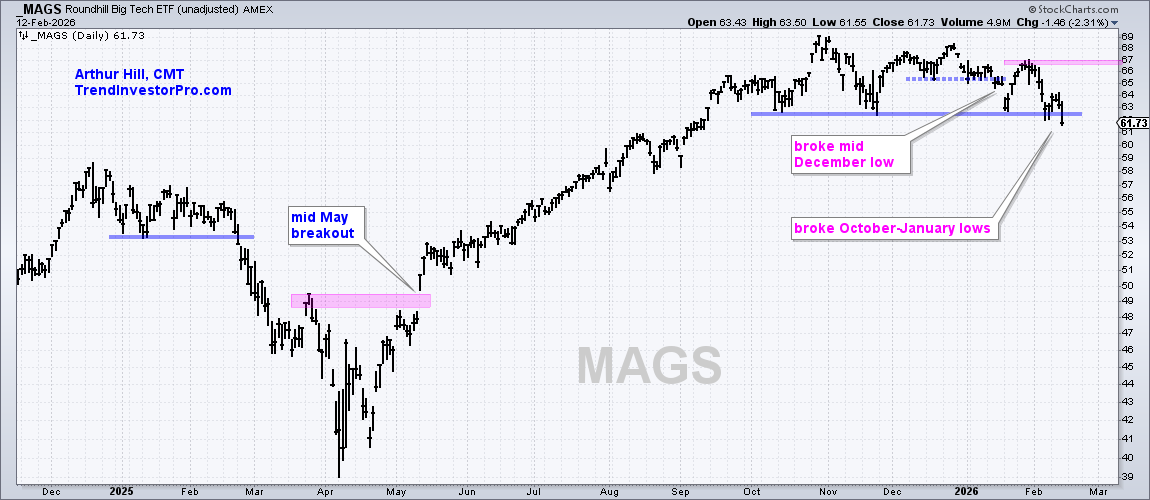
How long will this downtrend last? I take the Charles Dow approach to trend signals. The downtrend will remain in force until proven otherwise (reversed); neither the length nor the duration can be forecast. The late January highs mark the first resistance level at 67.
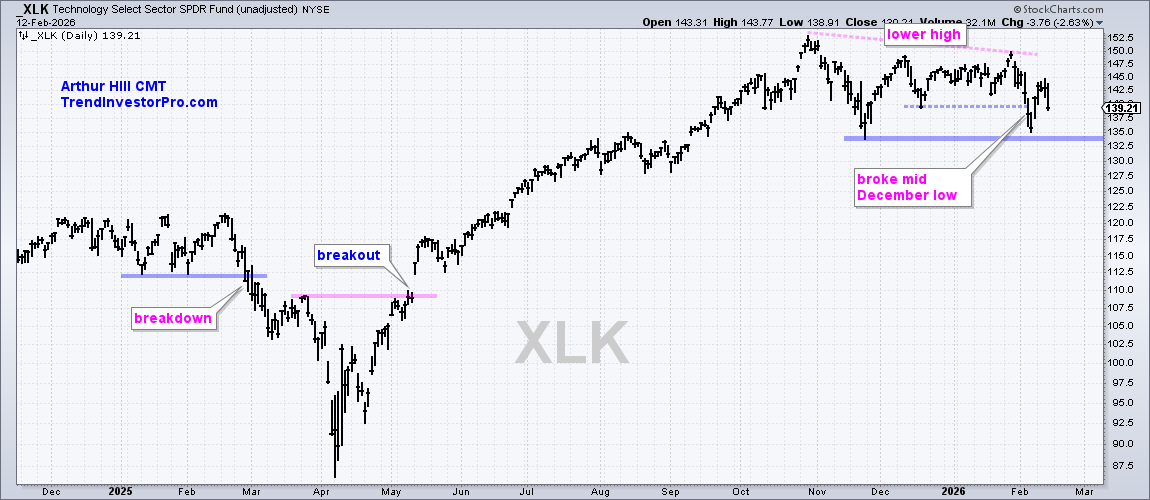
The next chart shows the Technology Select Sector SPDR (XLK) forming a lower high from October to late January and breaking its mid-December low in early February. This was the second domino. XLK has yet to break the November low, which marks key support. A break here would reverse the long-term uptrend because XLK would then have a lower high and a lower low.
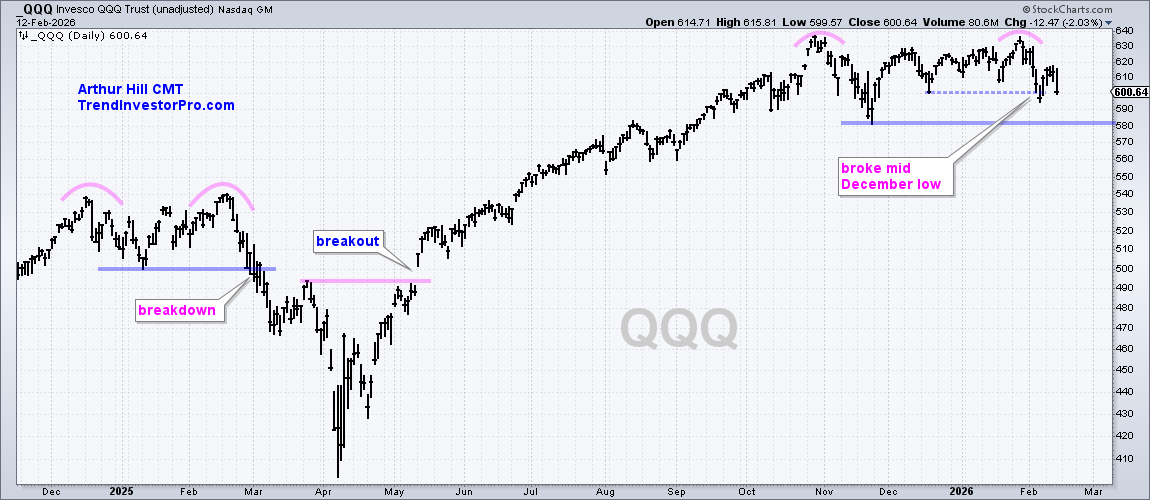
The next chart shows QQQ breaking the mid-December low in early February (third domino). Overall, a Double Top is taking shape with support at 580. A break here would confirm the pattern and reverse the long-term uptrend.
Recent reports and videos at TrendInvestorPro:
- Moment of Truth for Bond ETFs
- Copper and Base Metels Consolidate After Surges
- Three Stocks from Strong Groups (Housing, Utes, Defense)
- Aerospace & Defense ETF Sets Up as Utes Break Out
Click here to take a trial and gain immediate access.
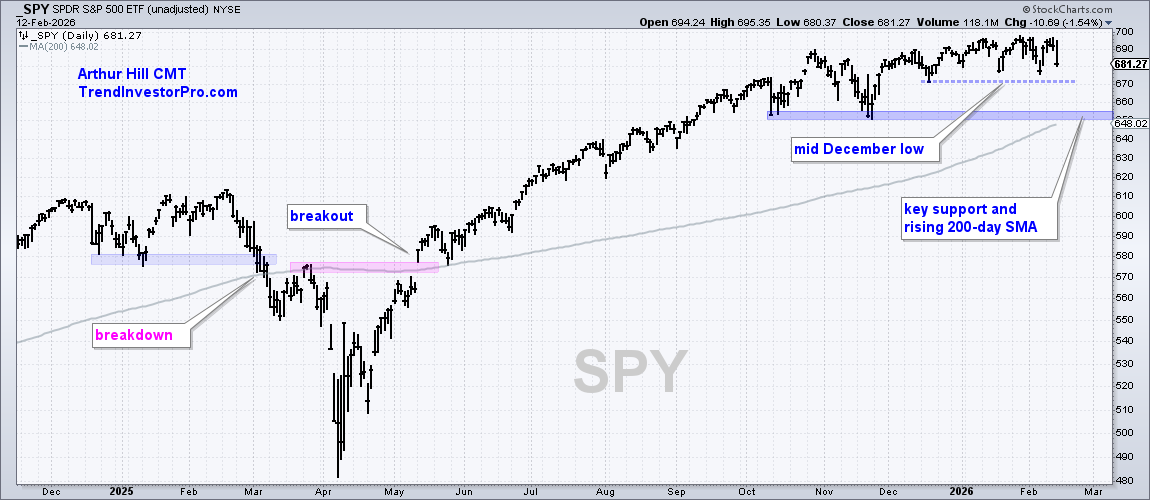
SPY Poised to Test Benchmark Low
The next chart shows SPY holding the mid-December low at 670. So far, SPY has yet to join MAGS, XLK, and QQQ with a break below this benchmark low. SPY bounced off the 670–680 area three times (mid-December, mid-January, and early February). A close below 670 would break this benchmark low and SPY would become the fourth domino. The October–November lows and rising 200-day SMA mark long-term support at 650.
Finance SPDR Plunges With Outsized Decline
I featured the Financial Select Sector SPDR (XLF) in late January because it became oversold within an uptrend. %B dipped below zero as XLF fell back to its rising 200-day SMA. This is a short-term bullish setup, but it ultimately failed as XLF fell 3.5% the last two days. Not all setups and signals work.
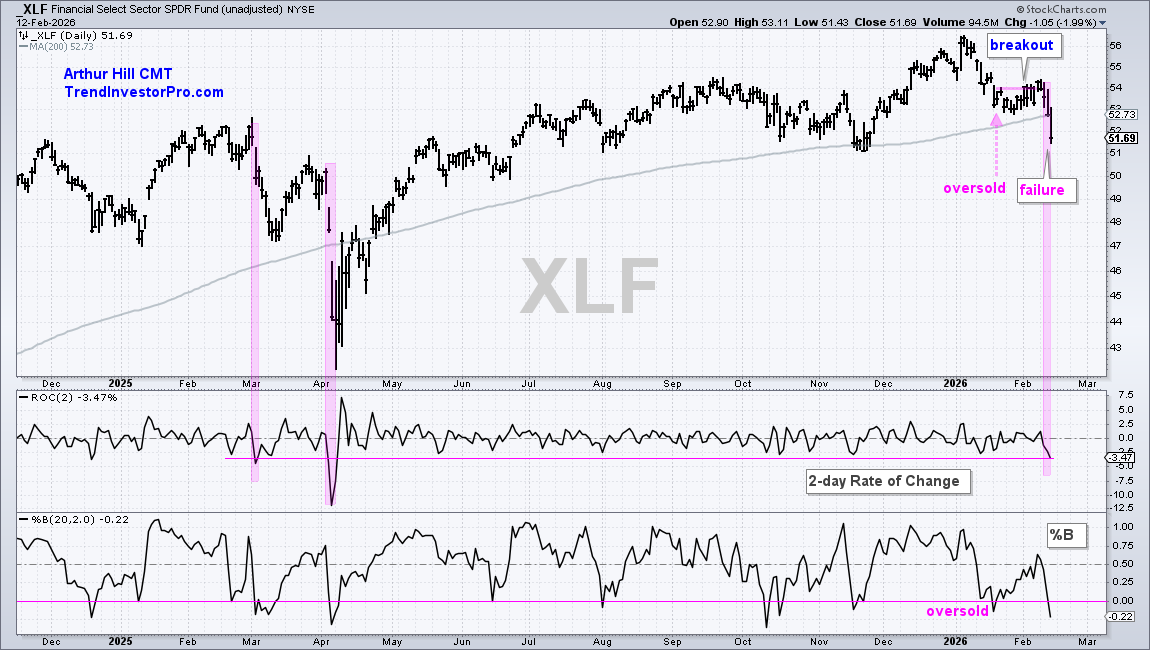
The 2-day 3.5% decline is the third sharpest two-day decline in the last 12 months. 2-day ROC hit -4.33% on March 4 and -11.88% on April 4th. These are also outsized declines, which are above-average declines that show a sharp increase in selling pressure. Not every outsized decline leads to a trend reversal, but the current outsized decline clearly fired a warning shot, as XLF decisively broke the 200-day SMA. Note that Financials is the second largest sector in the S&P 500 (12.7%). Technology is still the largest (33.4%).
Utilities and Bonds Pick Up the Slack
Utilities and Treasury bonds are benefiting as money moves out of the two biggest sectors in the market. The first chart shows the Utilities Select Sector SPDR (XLU) with a classic setup, one we have been featuring at TrendInvestorPro. XLU advanced to new highs in October, then corrected with a decline back to the rising 200-day SMA. This decline retraced 38–50 percent of the prior advance and formed a falling channel. These are the hallmarks for a tradable correction: return to rising 200-day SMA, ~50% retracement and falling channel.
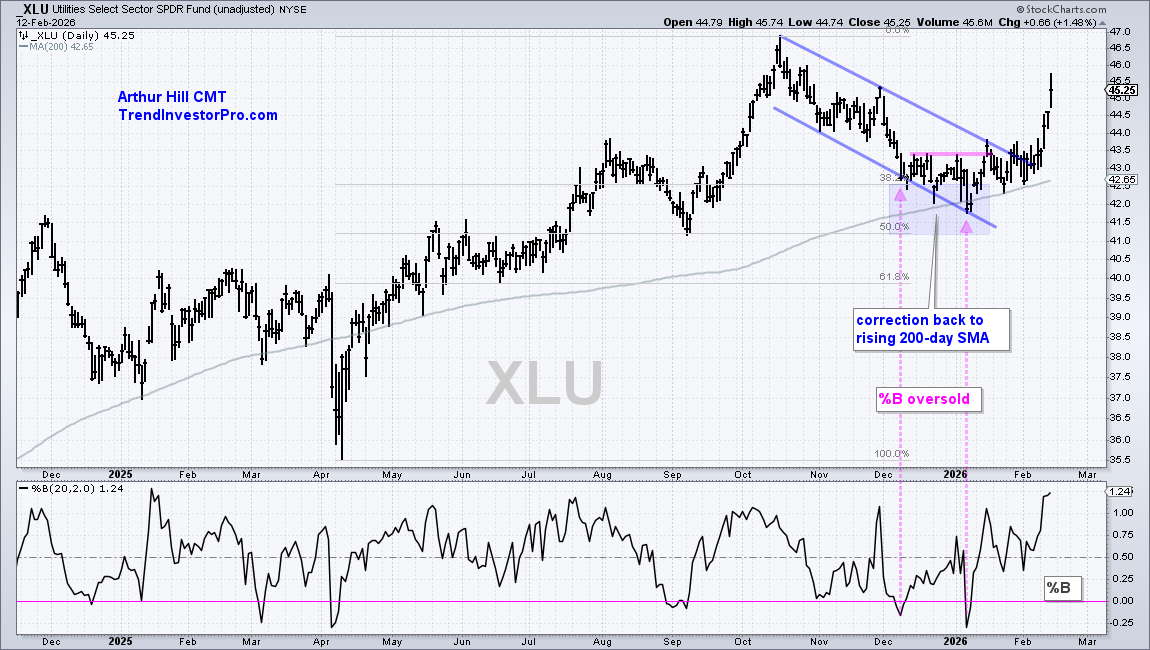
The bottom window shows %B becoming oversold in early December and early January. During this time, XLU firmed in the 42 area. The first breakout occurred in mid-January with a move above the mid-December highs. The second breakout occurred in early February with a break above the channel line.
The next chart shows the iShares 7-10 Year Treasury Bond ETF (IEF) moving from breakdown to breakout this month. IEF broke the 200-day SMA at the beginning of the month, but came roaring back with a breakout surge this week. Overall, IEF formed a falling wedge that retraced around 50% of the May–October advance. After battling the 200-day SMA for a few weeks, the ETF made a decisive move this week with a break above the January highs. This reverses the fall and signals a continuation higher.
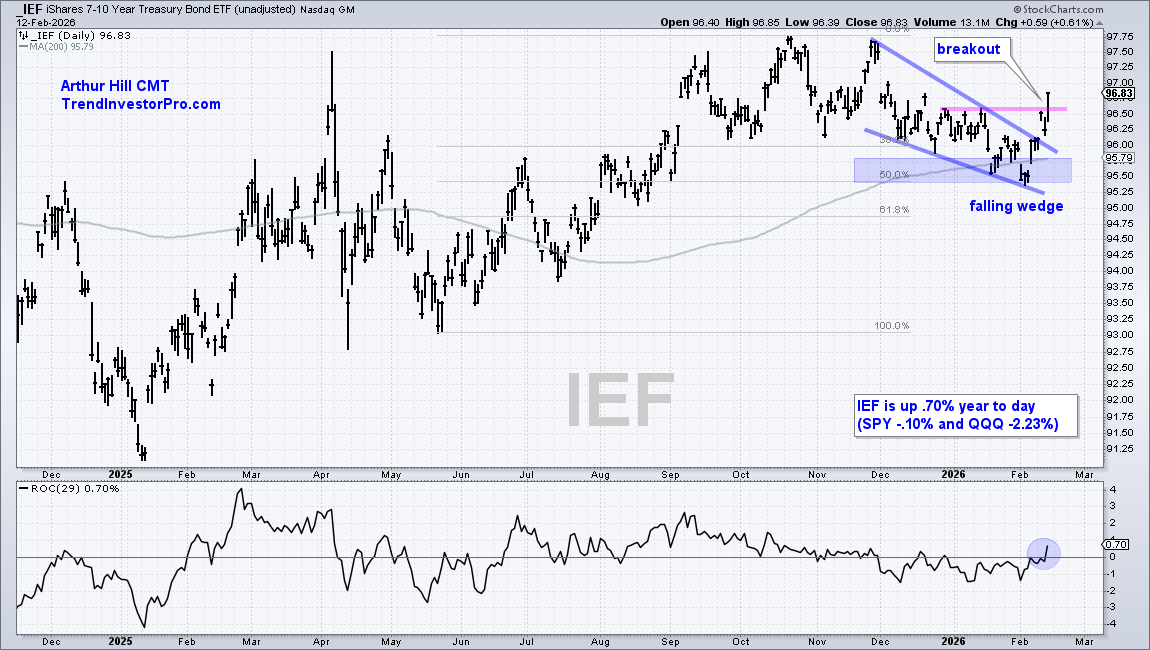
The bottom window shows the year-to-date change using ROC(29). IEF is up 0.70% year-to-date and outperforming SPY and QQQ. SPY is down 0.10% and QQQ is down 2.23%. Money prefers safe-haven bonds over large-cap stocks in 2026.
See TrendInvestorPro for more reports and videos.


