Maduro’s Fall, Energy’s Rise: Oil & XLE Are Back in Focus, Key Price Levels to Watch

Key Takeaways
- Geopolitical headlines meet strengthening charts as institutional exposure remains historically light to Energy
- Energy equities continue to outperform oil, signaling where investors are placing their bets
- Key technical resistance levels will determine whether the XLE rally has staying power
Will 2026 be the Energy sector’s year? Shares of the Energy Select Sector SPDR ETF (XLE) jumped 2.1% on the first trading day of 2026, then soared 5% on Monday morning, following the news of Nicolás Maduro’s capture.
Exxon Mobil (XOM), one of my key value rotation bellwethers for the new year, was up modestly, while the other domestic heavy-hitter in the integrated space, Chevron (CVX), jumped by the most since July 2022.
Chevron’s Outsized Importance
Chevron is the only producer with assets in Venezuela, and it’s a crucial component of XLE (17% of the ETF). More than 40% of the US Energy sector's funds are concentrated in CVX and XOM stock; if we have bull markets in those two stocks, it will be hard to ignore this somewhat left-for-dead small corner of the S&P 500.
Energy: The Ultimate Value Sector
Energy accounts for only 2.8% of the SPX near the lowest level on record. It’s not surprising, given WTI is trading near $57 per barrel, below where it sold 20 years ago. It’s a similar story with Brent, which usually trades about $3 above WTI.
Energy is also the most value-weighted of the 11 S&P 500 sectors. According to Russell Index weightings, 95% of the oil & gas niche is classified as Value. All told, the Energy Index returned 8.7% in 2025, lagging the broader US market by nearly 10 percentage points.
XLE's Dividend Appeal Remains Strong
Income investors are drawn to Energy, too. The dividend yield is 3.5%, more than two percentage points above the S&P 500's yield and its 20-year average dividend rate of 2.9%, according to data compiled by J.P. Morgan Asset Management.
Technical Picture: Improving, but Not Clear Skies
XLE gapped up 5% in early trading on Monday. It’s not clear skies ahead, though. Notice in the chart below that even with the rally toward $48, a bit of overhead supply remains in play up to the $49.50 peak from back in April 2024. Zoom out further and XLE is below the $50.76 all-time high notched during the shale-induced oil bear market in 2014.
A breakout through $51 would be fantastically bullish, perhaps auguring a measured-move upside price objective toward $63, based on the $37 to $49 range since early 2023.
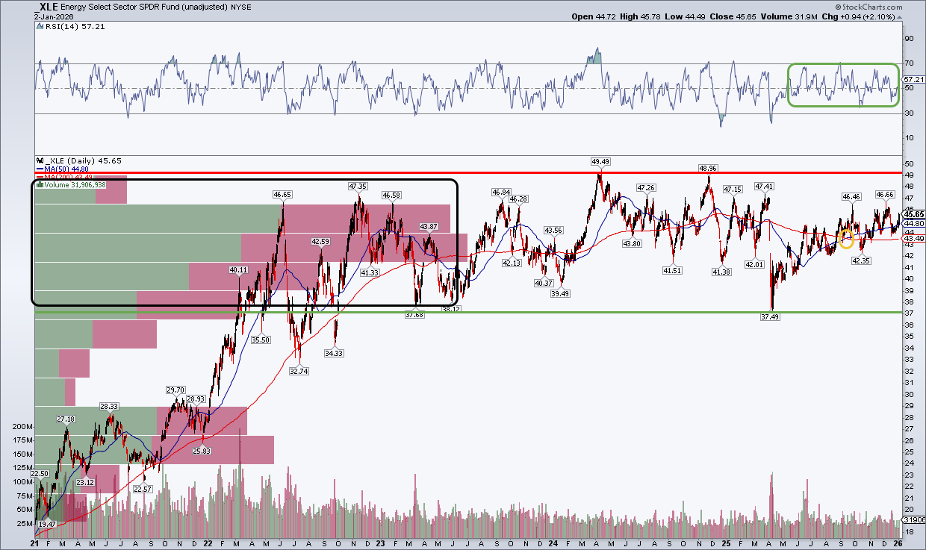
On a longer-term basis, we can’t rule out XLE ascending toward $90. Recall that the product plunged to $11.44 at its March 2020 low, just a month before the prompt month WTI infamously went negative.
I’d also call out that there is now a high amount of volume by price under the current level. That means there should be substantial buying demand if we see a decline in crude oil after the geopolitical uncertainty around Venezuela shakes out.
What’s more, a bullish golden cross pattern quietly occurred in September, portending this early-year intense upswing. Monday’s gain also ratchets up the RSI momentum oscillator — it has ranged in a bullish zone (above 35) since April, despite shares badly lagging the S&P 500.
Energy Stocks vs. Crude Oil
Energy stocks versus crude oil is another critical chart to gauge what’s working and what’s not. XLE looks great here, suggesting that investors may be better served by owning shares rather than a commodity fund or crude oil futures.
XLE has outperformed the United States Oil Fund (USO) by 43 percentage points over the last five years; the latest run-up comes after a nearly three-year sideways trade. Don’t fight the breakout and trend of a larger degree here. XLE may be the preferred overweight in 2026, not USO.
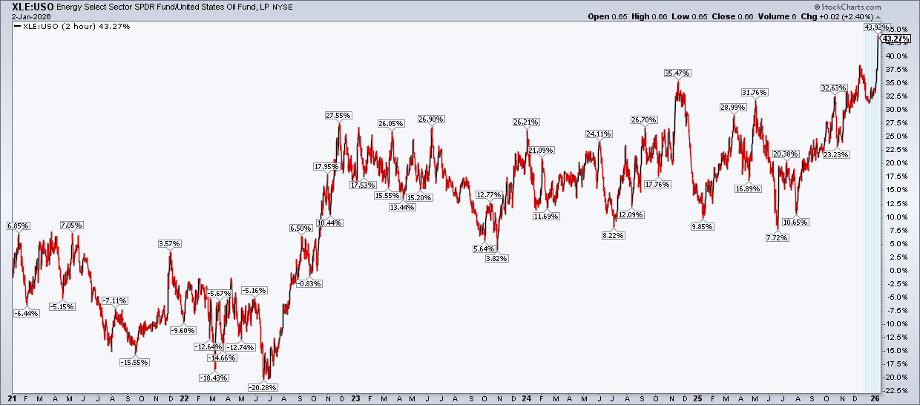
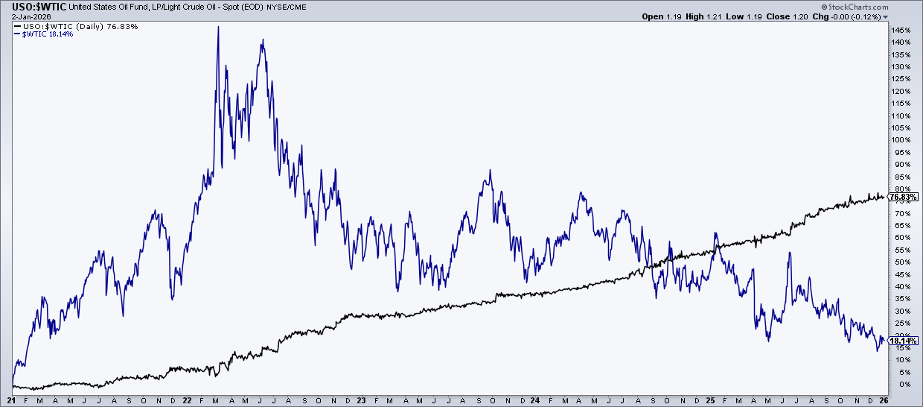
To be clear, USO is not a perfect WTI proxy. But interestingly, USO has outperformed the rolling prompt-month of WTI crude oil futures over the past 12 months (-10.4% versus -21.6%). Thus, USO flatters the much weaker oil price action.
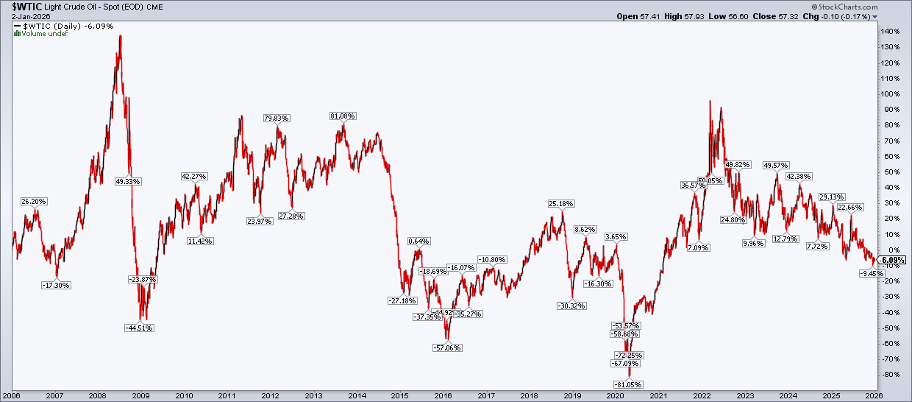
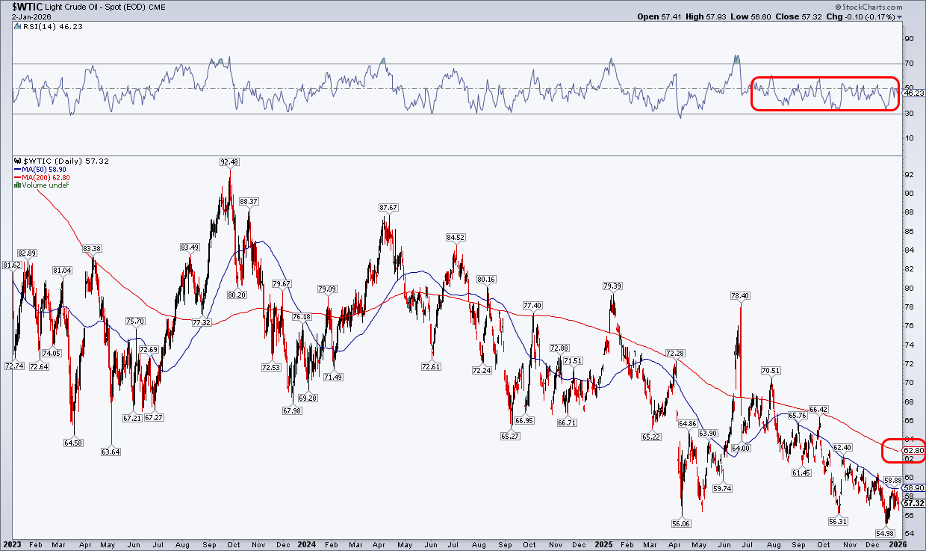
Crude Oil: Still a No-Touch
For oil itself, it’s a nasty chart. The dollar’s nearly 10% drop going back to the beginning of 2025 hasn’t been much of a tailwind. Fundamental supply-and-demand concerns are evident in the price trends. WTI’s long-term 200-day moving average is on the decline, now under $63 and above the current price. The 50-day moving average has been below the 200-day moving average since Q3 2024, and the general theme of lower highs and lower lows has kept the bears in charge.
I’d like to see a rally through the 200-day moving average, with the RSI above 60, to help confirm at least an intermediate-term reversal. For now, it’s a no-touch.
Positioning and Sentiment
Finally, it’s crucial to consider reported positioning and general sentiment. According to the December Bank of America Global Fund Manager Survey, portfolio managers were the most underweight Energy among all sectors.
Relative to history, allocation to oil & gas stocks was nearly two standard deviations below the 20-year average. In short, when things go from bad to just less bad, we can see intense portfolio shifts and fast price action.
The Bottom Line
Energy is off to a rip-roaring start to the year, and we are just two sessions into 2026. Last weekend’s news surrounding Maduro’s capture, and what it all might mean for Energy companies, may cause you to rethink your allocation to this long-time underperforming part of the market. Energy stocks look much better than oil, but XLE is not quite at new highs yet.
Disclaimer: This blog is for educational purposes only and should not be construed as financial advice. The ideas and strategies should never be used without first assessing your own personal and financial situation, or without consulting a financial professional.


